Data is everywhere. In fact, over 2.5 quintillion bytes of data are created every day, and that number keeps growing.
But here’s the real challenge – data alone doesn’t drive results. How you present and interpret that data does.
For businesses across the United States and globally, reporting tools play a critical role in turning raw data into clear, actionable insights that drive smarter decisions.
Capturing, organizing, analyzing, and interpreting data, enables organizations to excel in their fields.
Organizations use reporting tools to turn data into actionable insights and improve decision-making.
Only if the organizations are successful at all these levels, they can improve their processes and execute their marketing strategies.
However, locating data is only one page of the book that you’ve explored. There are several pages left out!
The most important step is presenting the data in an efficient manner. If this is not done properly, the time you spent on collecting and organizing data will be wasted.
But, how to present data effectively?
It’s simple – using reporting tools and software.
These are the tools that an organization depends upon for its reporting needs. They help you present your data in an impressive way.
Want to learn more about reporting tools and software? Read on…
What is a Reporting Tool or Software? (Definition)
Reporting tools are software applications that transform raw data into visual reports, dashboards, and insights to help businesses make data-driven decisions.
Reporting tools and software are used to present your data in a way, that makes it easy for the users to understand and interpret.
Rather than wasting a lot of time on reporting, reporting tools and software allow you to present the data in visualized forms easily.
While choosing a reporting tool, it is normal that you may come across the term ‘BI Reporting tool’. A BI or Business Intelligence reporting tool is nothing but an application that comes within a business intelligence software suite.
Before choosing a reporting tool, it’s important to decide the level of interaction you need with the report. Some reports are very interactive in nature and allow you to deeply explore the data just by clicking a button. These are called Interactive Reports.
They also let you view the data for your specific needs, by navigating, filtering, or sorting out.
Then there are Static Reports, which do not allow much interaction by the users. Unlike interactive reports, they cannot be navigated or altered by the end-users.
You should be wise enough to choose a reporting tool that fits within the arena of your reporting needs. The business goals of your firm must go hand in hand with the reporting in order to be beneficial for your organization.
Benefits of using Reporting Tools and Software
Reporting tools help businesses streamline operations, improve accuracy, and make faster, data-driven decisions. Key benefits include:
- Reduces time-consuming manual tasks
- Improves accuracy
- Gives valuable business insights
- Provides quality and accurate data
- Provides holistic insight and analysis
- Assists in managing workload
- Increases productivity and cut costs
…and more!
Want to know what are the best reporting tools and software out there in the market? Read on…
List Of Best Reporting Tools & Software
Here is a quick list:
- Microsoft Power BI
- Tableau
- Looker
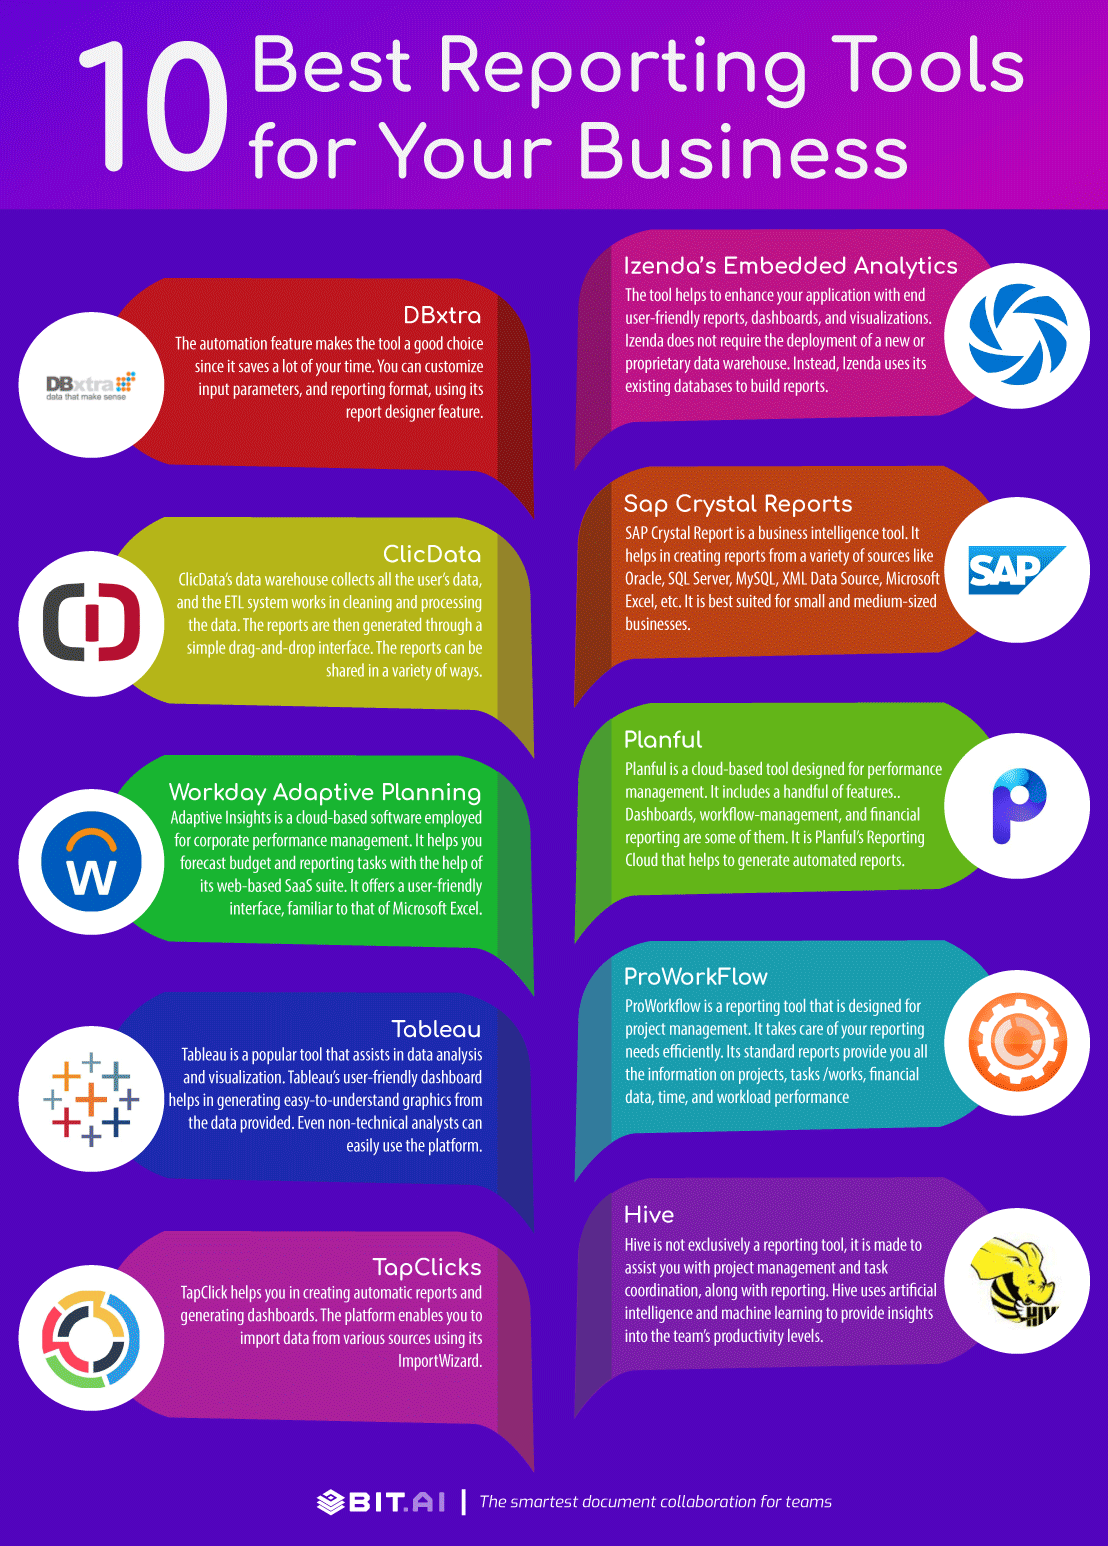
- SAP Crystal Reports
- Workday Adaptive Planning
- Zoho Analytics
- Hive
- Izenda
- ClicData
- TapClicks
- Planful
- ProWorkflow
1. Microsoft Power BI – Best for Microsoft Office Users
Microsoft Power BI is one of the most popular reporting tools in the world. Since Microsoft built it, it connects perfectly with Excel and other Office apps you already use every day. It takes your raw, boring data and turns it into beautiful, colourful charts and dashboards. You can easily share these interactive reports with your entire team. Best of all, it has a simple drag-and-drop feature, so you do not need to be a computer expert to build great reports.
Pricing: Free basic version available. Pro plan starts at $10/user per month.
If you prefer a tool that focuses heavily on beautiful visual graphics, the next software on our list is a massive fan favorite.
2. Tableau – Best for Data Visualization & Dashboards
Tableau is a popular tool, assisting in data analysis and visualization.
Tableau’s user-friendly dashboard helps in generating easy-to-understand graphics from the data provided. Even non-technical analysts can easily interact with the platform.
Thus, it becomes easy for anyone to interpret complicated data.
Apart from this, Tableau has a wide range of built-in functions, that assist the users in data analysis and calculations. Sharing is also made easy: users can share the reports while maintaining control over who has access.
Pricing: Ranges between $35 and $70 for a user per month.
Read more: 10 CRM Tools and Software You Should Explore Right Now!
3. Looker – Best for Real-Time Cloud Analytics
Looker is a smart, powerful data tool owned by Google. It is completely cloud-based, which means you can access your business reports from anywhere using just your internet browser. Looker is famous for helping teams find hidden trends in their data. It uses a simple format so anyone on your team can ask questions about the data and get instant, accurate answers. Plus, it builds easy-to-read dashboards that update in real-time as your data changes.
Pricing: Available upon request.
While cloud tools are great, sometimes you need a system built specifically for heavy enterprise reporting, just like our next option.
4. SAP Crystal Reports – Best for Enterprise Reporting
SAP Crystal Report is a business intelligence tool. It helps in creating reports from a variety of sources like Oracle, SQL Server, MySQL, XML Data Source, Microsoft Excel, etc. It is best suited for small and medium-sized businesses.
With the assistance of Sap, you can easily create advanced level reports, and make profitable decisions for your business. Sap includes a variety of features like content distribution in PDF, spreadsheet, and HTML.
The platform supports reports in multiple languages. Formatting is changed according to the language chosen. Above all, the safety and security of the data are ensured with Sap.
Pricing: $495 per license.
5. Workday Adaptive Planning – Best for Financial Reporting
Workday adaptive planning is a cloud-based software employed for corporate performance management. It helps you to forecast budget and report tasks with the help of its web-based SaaS suite. It offers a user-friendly interface, familiar to that of Microsoft Excel.
Also, the drag and drop feature of the tool is designed to enable direct integration to Microsoft Office. This is highly beneficial for new users since they do not have to leave the Office ecosystem in order to start with a new product.
Thus, if you are well-accustomed to the Microsoft Office features and interface, Workday adaptive planning is the best choice for you.
Pricing: Available upon request.
6. Zoho Analytics – Best for Small Businesses and AI Features
Zoho Analytics is a highly affordable and easy-to-use reporting software. It is absolutely perfect for small and medium businesses. You can pull data from almost anywhere—like your social media accounts, website, or sales software—and blend it all together in one place. The best part is Zoho’s smart AI assistant, named Zia. You can just type a question like “What were our sales last month?” and Zia will instantly build a custom chart for you!
Pricing: Starts at $24 per month for 2 users.
If you want a tool that mixes data reporting directly with team project management, you will absolutely love this next software.
7. Hive – Best for Project-Based Reporting
Hive is not exclusively a reporting tool, it is made to assist you with project management and task coordination, along with reporting.
Hive has the feature of dashboards that provides insights into the team’s productivity levels. This is done by employing artificial intelligence and machine learning.
The tool lets you manage your team through the allocation of resources, as per real-time-data. It also estimates the time spent on resource allocation and project planning, along with client billing.
Hive’s timesheet report makes it easy to record the time spent on each task or project. The platform offers integration with Google Drive, Zoom, Salesforce, One Drive, and a lot more tools through Zapier.
Pricing: $12/user per month.
Read more: 15 Business Intelligence Tools & Software Every Business Needs!
8. Izenda – Best for Embedded Analytics
Izenda’s Embedded Analytics helps you to integrate into an already existing framework. It is the most easily embedded BI platform for web applications.
The tool helps enhance your application with end user-friendly reports, dashboards, and visualizations. Izenda does not require the deployment of a new or proprietary data warehouse. Instead, Izenda uses its existing databases to build reports. This is done with the help of its automated query building engine.
Pricing: Available upon request
Read more: Virtual Data Rooms Guide For Better Data Management
9. ClicData – Best for Cloud-Based BI Reporting
ClicData is a cloud-based BI tool that is very easy to use. Its dashboards allow performance tracking.
ClicData’s data warehouse collects all the user’s data, and the ETL system works in cleaning and processing the data. The reports are then generated through a simple drag-and-drop interface.
The reports can be shared in a variety of ways: they can be sent by email, attached as PDFs, shared to the web and social media sites, or can be published on company intranets.
ClicData can be integrated with both iOS and Android devices. This makes it easy for the users as they can view the reports, no matter where they are.
Pricing: Depends on the license-type, and ranges from $25 to $439 per month.
10. TapClicks – Best for Marketing Reporting
TapClick helps you in creating automatic reports and generating dashboards. The platform enables you to import data from various sources, using its ImportWizard.
It also guides users from non-technical backgrounds in the whole process, making it easy for them. New users are provided the assistance of an ‘onboarding wizard’. TapClicks supports white-label custom branding so that you can generate customer-facing reports, true to the identity of your brand.
Pricing: Available upon request
11. Planful – Best for Financial Performance Reporting
Planful is a cloud-based tool, designed for performance management. It is an automated solution for assisting individuals or teams with financial processes.
Planful includes a handful of features. Dashboards, workflow management, and financial reporting are some of them.
It is Planful’s Reporting Cloud that helps to generate automated reports. It is equipped with built-in support for modes of reporting that require firm adherence. For example, US GAAP, and IFRS-compliant balance sheets.
Planful is good fit for a variety of industries, ranging from healthcare and education to advertising and distribution.
Pricing: Available upon request
Read more: 9 Powerful Mind Mapping Software & Tools You Need to Check Out!
12. ProWorkflow – Best for Project Reporting
ProWorkflow is a reporting tool that is designed for project management. It takes care of your reporting needs efficiently. Its Standard reports provide you all the information on projects, tasks /works, financial data, time, and workload performance. You can even build shareable reports on your own with the ‘Custom Reports’ option.
ProWorkflow has various additional features like providing resource reports on staff and time, time summary reports, and workload breakdown reports, individual and general project reports, task reports, and more.
ProWorkflow is made to integrate with many tools and software like Xero, Kash Flow, Box Storage, DropBox, Fresh Books, Google Drive, One Drive by Microsoft, and many more.
Pricing: From $10/user per month, which includes a maximum of 10 active projects.
Summing Up
Choosing the right reporting tool can directly impact how effectively your business makes decisions and scales operations.
If you fail at it, the consequent decisions or actions would also be a failure.
Therefore, it is necessary to ensure that your business always creates comprehensive reports, that provide you with ample and accurate information.
 Only if your company/organization has installed the necessary tools and software, you would be able to compete with your competitors.
Thus, it is essential to make an informed choice about selecting the right tools and software for reporting, and thereby make your company/organization stand out among the crowd.
Did we miss out on any of your favorite reporting tools and software? Tweet at @bit_docs and let us know!
Frequently Asked Questions (FAQs)
Q1. Do I need to learn coding to use these reporting tools?
No! Most modern reporting tools use a simple “drag-and-drop” design. If you know how to use basic software like Microsoft Excel, you can easily use these tools without writing a single line of code.
Q2. What is the difference between reporting and business intelligence (BI)?
Reporting simply shows you what happened in the past using clear data. Business Intelligence (BI) goes a step further and uses that same data to help you predict what might happen in the future.
Q3. Is it safe to put my company’s private data in the cloud?
Yes, it is very safe. Top reporting tools use bank-level security and strong encryption to make sure your private business data is never stolen or leaked to the public.
Q4. Can I easily share these reports with people outside my company?
Yes! Most of these tools allow you to quickly export your data as a PDF or Excel file. Many also let you send secure, private links so your clients or investors can view the live dashboards directly in their web browser.
Further reads:
- Business Report: What is it & How to Write it? (Steps & Format)
- KPI Dashboard: Definition, Tools, and Tips!
- Management Report: What is it & How to Create it?
- Periodic Report: What is it and How to Create It?
- 16 Best Business Tools Every Business Needs
- Best Time Tracking Software and Tools