Back in school, we had report cards which were considered the MOST important (but dreadful) documents of our life!
With all our grades in a single card, it was easier for our parents to just have one look at them instead of going through multiple test papers to see how well we had performed in academics.
In the business world, your individual test grades are called key performance indicators or KPIs. They are values that measure the overall performance of your company.
But, tracking all of them isn’t an easy feat. That’s why we have dashboards, the report cards of the business world. They are tools that provide you a visual overview of all your KPIs in a single place!
It’s the perfect tool to assess how well or how bad your company has been performing and helps you make better decisions and strategies to improve.
It’s a business necessity, which is why in this blog, we will take a closer look at KPI dashboards, the different tools, and tips to choose the best one!
So, what are you waiting for? Jump right in!
What is a KPI dashboard? (Definition)
A KPI dashboard is a management tool that collects, groups, organizes and visualizes a company’s key performance indicators in one place for easy comparisons and analysis of the business performance and growth.
Basically, they give you a birds-eye-view of how your business is performing. They translate enormous amounts of complex data into an understandable graphical format.
You can think of it like the dashboard on your car, which gives you information about your speed level, fuel level, the distance traveled, and other things. All the data you need in a single place!
Now that we know what KPI dashboards are, let’s take a look at some of the best ones out there! Dive in, folks!
List of KPI Dashboard Tools and Software
1. Klipfolio
 Let’s start with Klipfolio, a cloud app that allows you to share real-time business dashboards that track KPIs and monitor metrics. It is a great KPI dashboard because it helps you import and merge your data from over 300 data sources under a single platform.
It has visually appealing dashboards that encourage data exploration through views and filters and supports multiple channels of sharing such as email, links, Slack messaging, and more. It also automatically syncs your data and helps track your history as well.
Furthermore, this dashboard can be viewed on web browsers, TV monitors, and even mobile devices!
Key Features:
- Supports over 100 cloud applications like Twitter, Google Analytics, Xero, etc.
- Pre-built data visualization
- Automatically syncs data
Pricing
- $24 / 5 users
Read more: 12 Marketing KPIs Every Marketing Team Should Monitor!
2. Sisense
Next on the list is Sisense, a KPI dashboard that allows you to monitor all your KPIs ranging from net profit to onboarding time spent on clients. It gives you snapshots of your performance allowing you to adjust your strategies to stay on track.
What makes Sisense a great KPI dashboard is that it has in-built collaboration tools that allow you to work together, make comments, and share reports. It offers a library that has industry-specific KPIs to help you get insights into different areas such as finance, healthcare, HR, etc.
What’s more? Sisense supports end-to-end encryption of data.
Top features:
- Supports in-built collaboration tools
- Has an industry-specific KPI library
- End-to-end encryption
Pricing
- Standard Plan starts at $83.00/month per employee
- Professional Plan at $160.00/month for unlimited users
3. Tableau
If you are looking for an easy-to-use KPI dashboard that supports data visualization and data analytics, then Tableau is what you need.
Tableau supports data literacy for all by employing a self-service model where you can drill down, filter, and blend all your data, and also supports drag-to-drop functionality and natural language processing.
With Tableau, you can select and easily create any type of visualization, ranging from basic bar graphs and pie charts to advanced Histograms and Gantt Charts.
Moreover, Tableau lets you track and monitor your KPIs on your mobile phones and provides alerts through push notifications.
Top features:
- Provides a private server
- Has a user-friendly interface
- Establishes thresholds for evaluation
Pricing
- $42 user/month
4. Grow
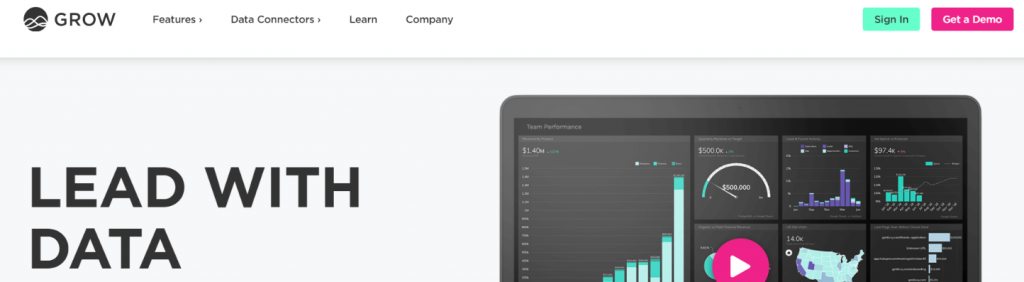
As its name suggests, Grow is a KPI dashboard that helps small to medium-sized businesses grow by providing actionable and comparable insights about their business performance data.
It helps you track different types of KPIs ranging from customer acquisition costs to gross profit margin through custom views, dashboard metric filters, drilling, slicing, date range comparisons.
Since Grow is cloud-based software, it provides native integrations to ads, social media, and CRM platforms, and can import data from a wide variety of sources so that you can start quickly and analyze your data in real-time
It has pre-built interactive and customizable KPI dashboards that you can share and display via your web browser and mobile apps. What’s more? It allows you to have an unlimited number of users and it’s highly secure!
Top features:
- Provides native integrations
- Has pre-built interactive and customizable dashboards
- Supports unlimited users
Pricing
- Provides customized pricing based on a company’s needs and use cases.
Read more: 10 Best Reporting Tools and Software for Businesses
5. Geckoboard
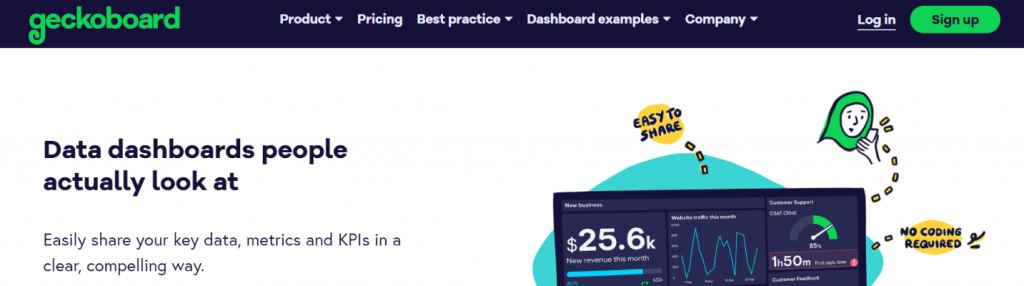
Next up on the list is Geckoboard, a KPI dashboard that lets you collect, share and visualize all your important information within and outside your company.
Geckoboard pulls data directly from programs such as Excel files and Google Sheets to create a clear and beautiful visualization of your company’s KPIs. It also has a drag-and-drop functionality that that makes it easy-to-use software.
With Geckoboard, you can track all your information in real-time from a single place and quickly share it as secure links via email or chat. It supports a full-screen display of its dashboard on TV screens and also lets you access it on your own mobile phones.
What’s more? It has over 80 integrations including software like Google Analytics, Shopify, Salesforce, etc.
Top features:
- Pulls data from Google Sheet or Excel file to create live visualizations
- Offers secure link sharing within and outside the office.
- Supports over 80 integrations
Pricing
- Starts at $25 user/month
6. Databox
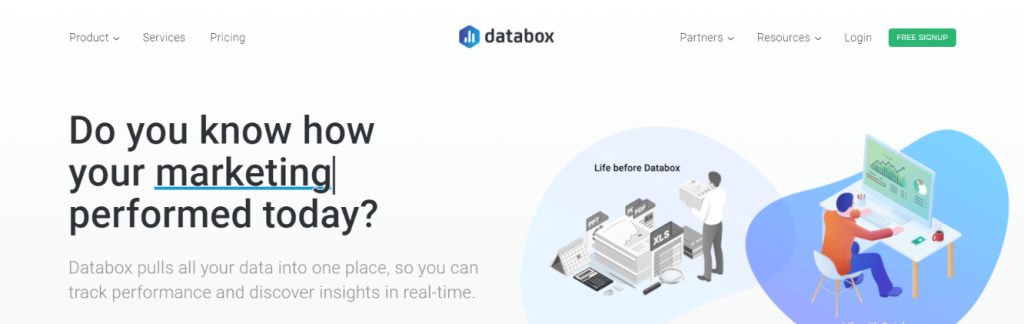
Databox is an amazing KPI dashboard that lets you mix and match your data from different sources under one dashboard to get a complete overview of your company’s performance. It pulls all your data into a single place and provides real-time insights as well as the latest trends.
Databox provides a very neat user interface and offers over 70 third-party integrations such as Google Analytics, Salesforce, HubSpot, Facebook, Shopify, and more!
It also has a Databox library that offers over 200 pre-built report templates that can be customized. Furthermore, it allows you to set daily, weekly, monthly or annual targets for any business KPI that you are tracking.
Top features:
- Allow you to track time-bound, numeric goals
- Has an alert function that notifies the user of any trends or sudden changes.
- Offer over 70 third party integrations
Pricing
- Free for up to 3 users
- For larger teams – $49
Read more: 15 Business Intelligence Tools & Software Every Business Needs!
7. Zoho Analytics
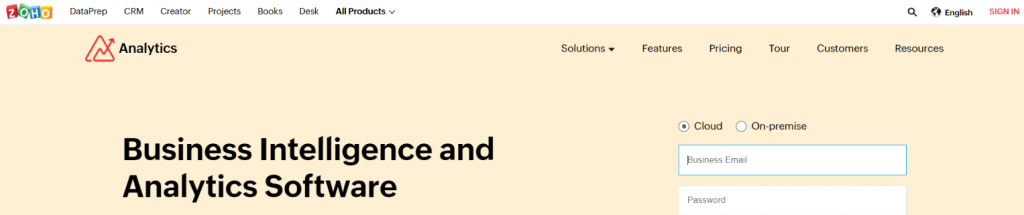
Zoho Analytics is an analytics solution that lets you analyze your data by creating insightful reports and visualize them through dashboards. No more emailing reports as it has a great KPI dashboard that lets you share and collaborate data within the software itself.
Zoho has a sleek spreadsheet-like interface with drag-and-drop functionality and tools that allow you to visualize your data in charts, widgets, pivot tables, geo-visuals, and tabular views.
Zoho Analytics ensures complete safety and security of. What’s more? You can create an unlimited number of reports and access them from anywhere!
Top features:
- Imports data from multiple sources
- Regulated by Zoho Security Practices
- Allows unlimited creation of reports
Pricing
- Plans starting at $25/month for 2 users.
So now that you know all the amazing KPI dashboards and tools out there, here are some tips on choosing the best one out of the flock.
Tips to Choose the Best KPI Tool:
Of course, you would want to choose the best KPI tool for your business, but no one tool serves as the best one for all companies because everyone’s needs are different.
Since there are no hard and fast rules for finding the best one, we can provide you with some general tips that you must etch in your mind while choosing a KPI tool. Let’s go!
1. Data Visualization
This is what brings all your data to life! Look for dashboards that are customizable with flexibility in presentations and offer engaging visualization features such as heat maps, geographical mapping, multiple chat styles, etc.
Make sure your dashboards can incorporate real-time information and support a high-level design appeal for reporting features.
2. Usability
Choose a KPI tool that is not dependent on your IT department, which basically means that it will be easy to use for your employees.
Go for the latest release that has new features and integrations that make it seamless for users. It would be great if there is an availability of product training so that your employees can easily adopt the new tool without causing any delay or affecting their performance.
Read more: Key Performance Areas (KPA) Simplified: Types, Benefits & More!
3. Accessibility
If you want to reap the full benefits of a tool, you need to ensure that it is portable and accessible across all platforms and devices. Makes sure it provides high speed and real-time updates.
4. Security
Security is absolutely non-negotiable, so you must choose a KPI tool that lets people set permissions or passwords for access to sensitive information so that your data cannot be accessed, transmitted, or modified by random or unauthorized users.
5. Pricing
Pricing entirely depends on your company’s ability to pay high costs for maintenance, physical space, and human resources. So, research your options and be clear about the lifetime costs of a subscription service and how it will affect your overall expenses.
Conclusion
… and that’s basically it! Tracking your performance is just as important as any other function of a business.
So we have told you about some of the best tools for tracking KPIs and we have also given you tips on choosing the best one for your business.
Now, all there’s left for you to do is dash out and climb aboard the best dashboard!
Further reads:
- Top 10 Key Performance Indicators You Need To Measure
- OKRs Vs. KPIs: Breaking Down The Types and Differences!
- Key Performance Areas and KPIs: Meaning and Examples
- 12 Sales KPIs Your Sales Department Should Measure!
- Objectives and Key Results (OKR): Definition, Importance & Examples!
- KPI Report: What it is & How to Create a Perfect One?
- 11 Dashboard Software You Should Explore!