So, you’ve conducted a survey and came up with strategies to get the most responses to that survey.
Now what?
A survey does not end after you managed to capture a lot of responses. Responses are just plain data.
A survey report is how you convert that data into information and implement the results in your research.
Data left unanalyzed is just a mess of numbers and words, which do no good to anyone.In this article, we’ll show you the ins and outs of writing a fantastic survey report.
Before getting into the step-by-step process, let’s first understand what survey reports are.
What is a Survey Report? (Definition)
A survey report is a document that demonstrates all the important information about the survey in an objective, clear, precise, and fact-based manner.
The report defines the:
- The objective of the survey
- Number of questions
- Number of respondents
- Start and end date of the survey
- The demographics of the people who have answered (geographical area, gender, age, marital status, etc)
- Your findings and conclusion from the given data
All this data should be presented using graphs, charts, and tables. Anything that makes the data easy-to-read and understand.
After reading your survey report, the reader should be clear on:
- Why you conducted this survey.
- The time period the survey ran.
- Channels used to promote and fill up the survey.
- Demographics of the respondents.
- What you found out after conducting the survey.
- How can the findings be implemented to create better results?
Why a Well-Written Survey Report Is Crucial for Accurate Insights?
Here are four compelling reasons why you should always write a survey report:
1. It makes a powerful impact
Survey reports reveal the hard numbers regarding a scenario. It is always impactful when you include stats with facts.

For instance, saying “80% of women working in the media sector claim to have faced workplace harassment at some time in their life” is more impactful than saying “Many women face workplace harassment.”
Data is much more powerful when we know the exact proportion of it. People connect with issues that come with large numbers, as they stir up the room and demand for action.
Read more: Creating a Customer Survey: Steps, Tips & Best Practices for Deeper Insights
2. Paves the way for decision making
When you categorize large data into easy to read charts and graphs, it gets converted into useful information. This information is then used by the management to make decisions that will directly affect the company.
For example, let’s say that you performed a product feedback survey to find out the preferences of your target audience.
Based on their answers, the features of your product can be amended.
After all, it’s the people for whom you are making the product, right?
3. Noticing Trends
This is a common saying among surveyors and researchers. It implies that when you ask one question again and again over time, you find a trend of change in the answers.
Thus, survey reports help track trends in the market that also provides insight into what the future could hold.
For instance, if we talk about fashion, bell-bottom jeans were a huge trend in the ’70s. Then, the ’80s saw carrot pants followed by ankle-high skinny jeans in the 90s.
Fashion researchers track these changes and bring back some of the old trends. Bell-bottoms and carrot pants came back and Gen Z is loving it!
4. Helps to gather explicit data
Explicit data in survey terms means first-hand data that is obtained without any tampering in the process. Data often gets contaminated, when it is not received first-hand and transfers through various mediums.
Survey reports help express information fully and clearly without beating around the bush. However, the possibility of a respondent altering the data, lying, or manipulating should be considered.
First-hand data should not be blindly followed. It must be supported by some underlying facts.
With this thought in mind, let’s move to the actual steps required to write a survey report.

How to Write a Survey Report in 5 Easy Steps?
If you are here trying to learn how to make a survey report, we can assume that you have already taken two steps:
- Created & distributed a questionnaire/survey
- Received responses to it
When its time to analyze the collected data, take the following steps:
Step 1: Export Data from Survey
Whether you used Google Forms, Typeform, Survey Monkey, or any other survey platform, the result of the survey conducted comes in two ways. One is a spreadsheet document filled with data and the other is the graphical and chart representation of the data.
Export this real-time information in your survey report by either downloading, printing, or simply copy-pasting the graphical results of the survey into your survey report document.
This legitimates your survey and lets the reader see the exact survey you conducted and its digital results without any edits or data manipulation.
Step 2: Filter, Analyze and Visualize Data
The next step is to filter the data. You’ll want to look out for corrupt, biased, duplicate, or inaccurate information and filter it out. This step is also called cleaning the data. The cleaned data is then analyzed to infer results.
Analyzing the data includes grouping similar aspects, categorizing, and identifying patterns.
For instance, XYZ company conducted an employee satisfaction survey.
In it, they asked, how is the relationship between you and your immediate supervisor?
According to the data, it is found that 80% workforce said that their supervisor was warm and friendly. the other 20% gave a mixed kind of response.
On analyzing it, it was determined that most of the workforce helps each other and the pyramid of command is running successfully.
So the XYZ company will group this information and present it like: ‘4 out of 5 employees working in XYZ organization claimed to have a warm and friendly relationship with their supervisor ‘
With this, it can be concluded that the work environment of XYZ organization is good. They will also use this information to attract more workforce towards the organization.
It is always better to put the information in statistical terms. This makes the visualization process easier. While visualizing, you collect the analyzed data in the form of easily understandable charts, graphs, or figures.
Visualization makes the data go alive!
Step 3: Interpret Data
At this point, you have all your information ready and baked. It time to eat!
By eating, we mean inferring what you found out from the collected data. Observe your findings with supporting facts and figures and also think about the next step/recommendations to make a change.

But hey, we can’t eat before presenting the dishes first. Presentation is an important element!
However, not every survey report is presented the same way. This leads us to the next step…
Step 4: Recognize the Type of Survey Report
There are various kinds of survey reports, depending on the nature and objective of the survey. Recognize what type your survey falls into. Some common ones include:
1. Employee Satisfaction Survey
This is done to determine the opinion of the employees regarding the workspace. It helps in increasing employee motivation and makes them feel heard.
2. Customer Satisfaction Survey
You must have come across one of these in your life. Many restaurants, salons, companies ask their customers to fill out a form giving feedback.
3. Market Research Survey
This type of survey is performed to find out the preferences and demographics of the target audience. It also helps with competitor research.
4. Social Survey
This is a survey conducted to find out stats about social topics such as climate change, waste management, poverty, etc.
Step 5: Define Structure of the Survey Report
1. Title Page
Add the title of your survey, name of the organization, date of submission, name of the mentor, etc.
2. Background and Objective
Provide a background of the topic at hand, giving insight as to why this survey is conducted. The reason behind it is known as the objective of the report.
3. Methodology
Your methodology should tell the readers about the methods you used to conduct the survey, channels used to spread it, and the ways used to analyze the received data.
4. Conclusion
The conclusion should contain a detailed picture of your findings. It includes listing what you determined by the survey in form of facts, figures, and statistics.
5. Recommendation
Give the reader the next step or CTA (call to action) in your survey report. After sharing the survey and analyzing the results, offer some insightful recommendations to make a change, amend or implicate something.
For instance, to improve employee satisfaction and communication, we can hold a weekly town hall meeting.
6. Appendices
Include detailed information that is too long/complicated to put in the report but is used or referred to in the report. It may include long mathematical calculations, tables of raw data, in-depth charts, etc.
7. References
Make sure to properly credit every source that you extracted information from. This is very important as the absence of references puts a threat of plagiarism in your report.
8. Table of Contents
Usually, it is included at the beginning of any report or project. However, in the case of the survey report, the table of contents comes at the end. It lists everything present in the report divided into sections and sub-sections.
9. Executive Summary
It is a crucial element of your report. Not everybody has the time to go through the entire survey report. The executive summary should be able to summarise the whole survey in one or two pages.
Okay great so now you know how to write a Survey Report, how about we show you the smartest & fastest way for you to create yours?
Bit.ai: The Ultimate Tool for Creating Survey Reports
 Bit.ai is a document collaboration platform that helps you create modern digital integrated documents. Bit documents take very little time to create as you can focus on the content and have Bit automatically help you with your document design so that your document is on point with your branding.
Easily weave any type of digital content within your Bit docs like file attachments, visual web links, cloud files, PDF previews, math equations, videos, and much more. Bit integrates across 80+ popular applications like Google Sheets, OneDrive, Tableau, Typeform, Lucidcharts, and much more! Now your content, wherever it may reside can part of your survey report.
Bit’s impressive editor is collaborative so that you can work with your team at the same time and create smart documents that help you communicate more effectively together.
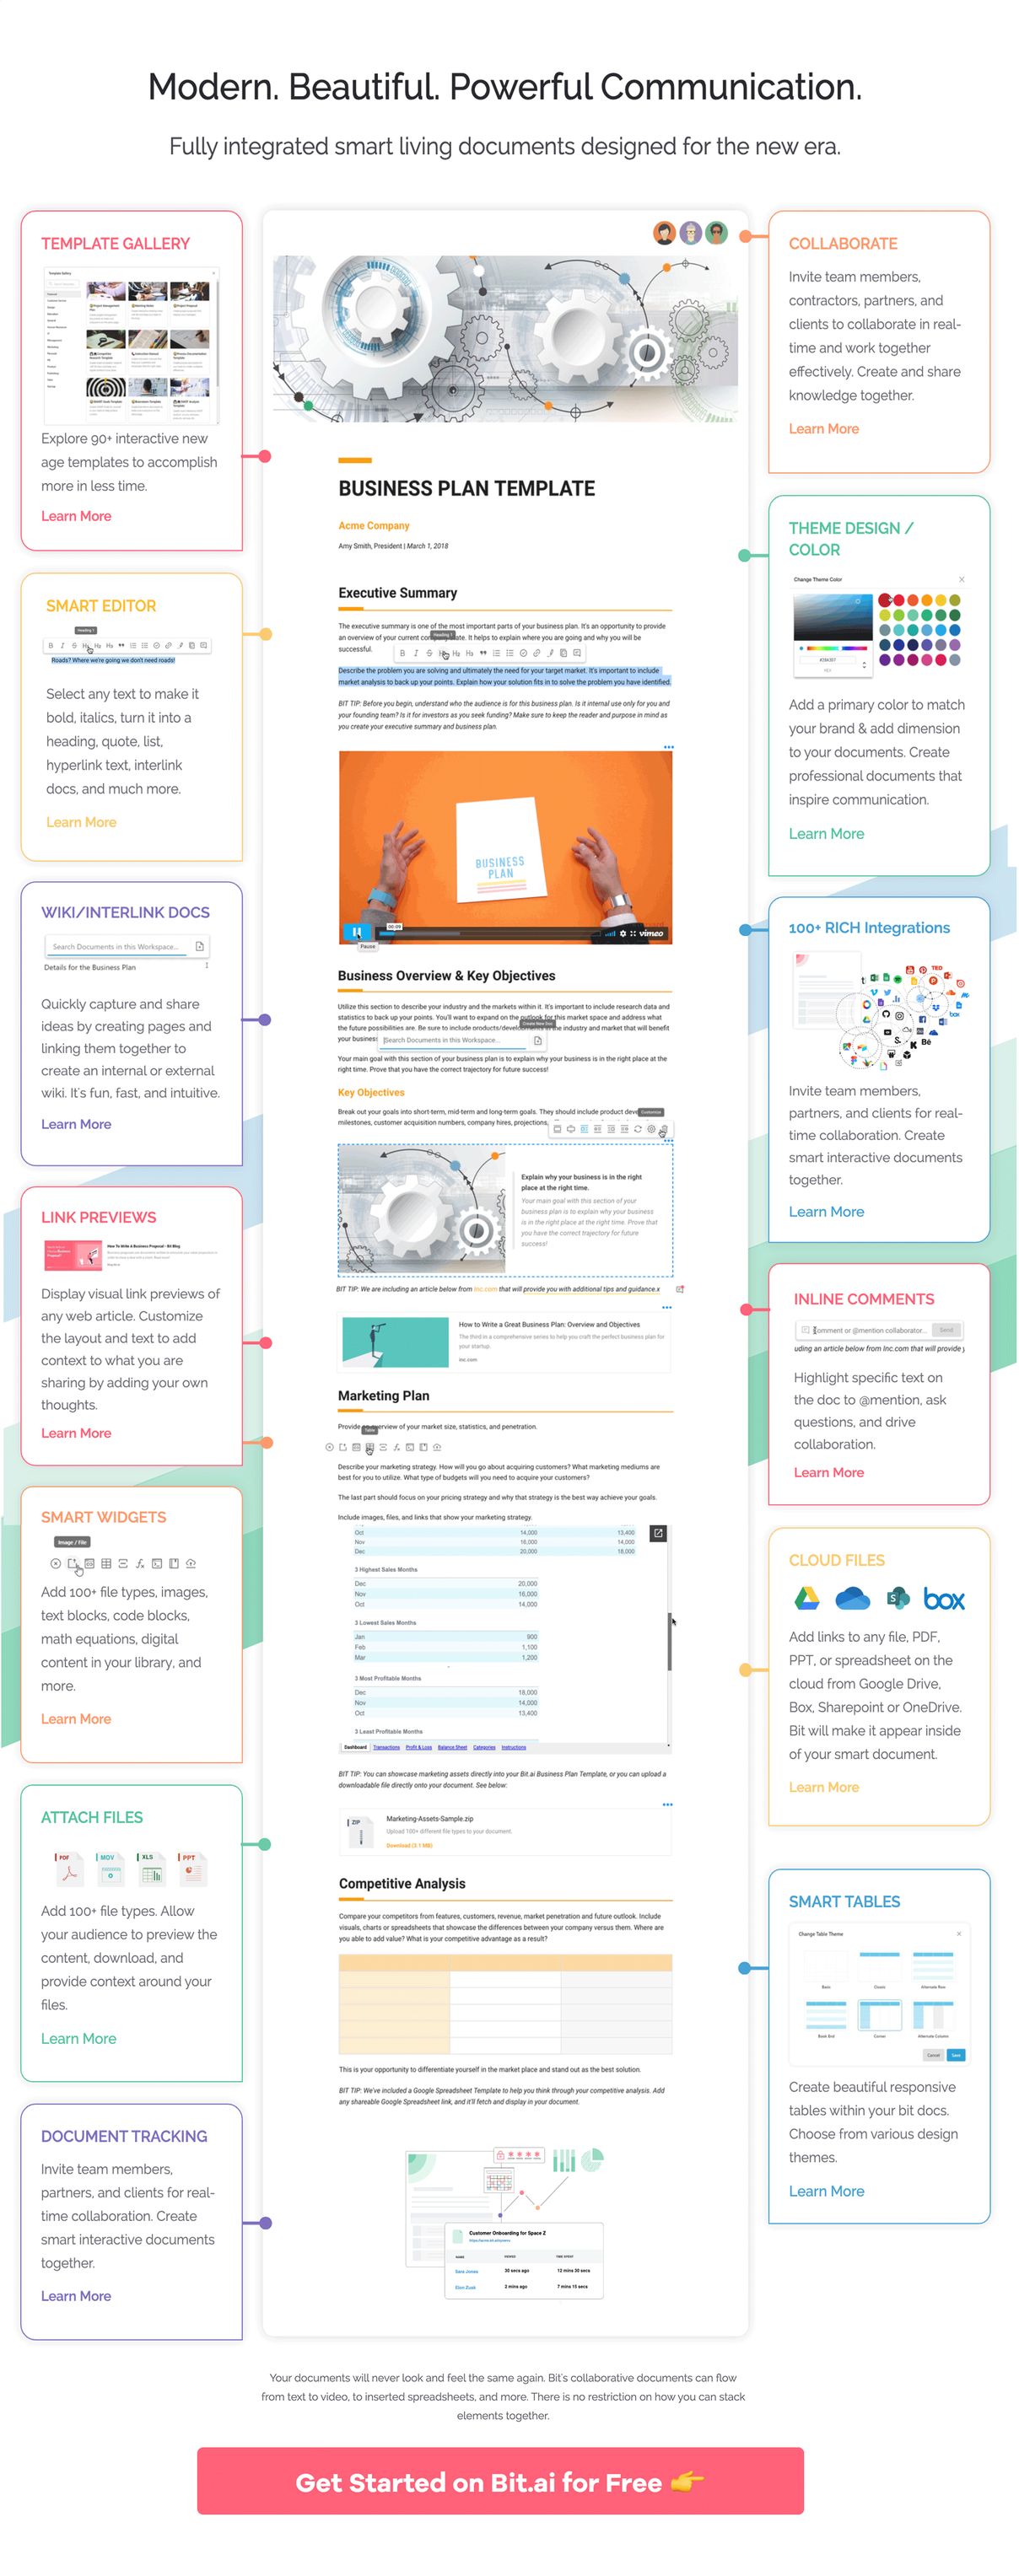
Your survey report can contain an automated table of contents, embedded Excel sheets of tables, interactive Tableau charts, PDF presentations, Google Form surveys, and much more! Having this information in one place allows you to easily add context to each element you share. Reduce the amount of scattered data and information and tie it together beautifully in one place.
When you’re ready to share it with your world, you can invite your team members to view your report inside of Bit. You can also share it with a live link, embed it on a website, or share a trackable link to track the engagement levels of your report. If there need to be additional security layers placed, you can invite your audience in as guests where they need to login to view your survey report.
Bit will change the way you communicate and is the ultimate tool necessary to create impressive survey reports!
Our team at bit.ai has created a few awesome business templates to make your business processes more efficient. Make sure to check them out before you go, your team might need them!
- SWOT Analysis Template
- Business Proposal Template
- Business Plan Template
- Competitor Research Template
- Project Proposal Template
- Company Fact Sheet
- Operational Plan Template
Checklist for Survey Report
Crafting a compelling survey report takes effort, but ensuring its clarity and professionalism is crucial. Before hitting publish, use this checklist to give your report a final polish:
- Clear Introduction: Does your introduction effectively introduce the research question, survey methodology, and target audience?
- Actionable Insights: Does your discussion section translate findings into actionable insights for your audience?
- Objectives: Are the objectives specific, measurable, achievable, relevant, and time-bound (SMART)?
- Author Information: Have you included your name, affiliation (if applicable), and contact information for further inquiries?
- Formatting Consistency: Is your report formatted consistently throughout (headings, font size, margins, etc.)?
- Visually Appealing: Are your data visualizations clear, easy to understand, and professionally designed?
- Grammar and Proofreading: Have you meticulously proofread your report for grammatical errors, typos, and sentence structure issues?
- Citations: Are all sources properly cited using a consistent style guide (APA, MLA, etc.)?
Wrap Up
Conducting a survey isn’t easy.
From preparing the questionnaire to interpreting and presenting the data, it can seem like a heck of a job.
With Bit.ai’s smart document collaboration platform, at least you don’t have to worry about creating an interactive, impressive survey report!
So what are you waiting for?
Try out Bit’s survey report template and let us know how you liked it by tweeting @bit_docs.
FAQs
Que: What are three types of survey reports?
Three common types of survey reports include descriptive reports (summarizing findings), analytical reports (interpreting data), and comparative reports (comparing results across groups or time).
Que: What is the purpose of writing a survey report?
The purpose of writing a survey report is to communicate the findings of a survey clearly and comprehensively. It serves to inform stakeholders, decision-makers, or the public about survey results, their implications, and potential actions.
Que: What are the 8 parts of survey report?
A typical survey report includes:
- Introduction
- Objectives and scope
- Methodology
- Executive summary
- Findings and analysis
- Recommendations
- Conclusion
- Appendices (optional, for detailed data)
Que: What is a full survey report?
A full survey report is a comprehensive document that details the entire process and outcomes of a survey. It typically includes information on objectives, methodology, findings, analysis, conclusions, and recommendations.
Que: What are the 5 survey methods?
Common survey methods include:
- Questionnaires (online, paper-based)
- Interviews (structured, semi-structured, unstructured)
- Focus groups
- Observation
- Experiments (controlled studies)
Further reads:
- Business Report: What is it & How to Write it? (Steps & Format)
- Incident Report: What is it & How to Write it the Right Way!
- Business Report: What is it & How to Write it? (Steps & Format)