Learn how to write project reports that wow your clients with a new-age editor!
Your clients are busy people. You have done everything right- applied a winning strategy, pitched with the right enthusiasm, and won your clients over by showing your credibility and trustworthiness.
However, in order to keep those clients for the long haul, you have to have a healthy relationship with them. The key to a stable, ongoing, and healthy relationship is communication.
If you want to maintain a good relationship with clients and retain their business, it’s important that you communicate effectively. Every point of interaction with your clients needs to be fine-tuned.
You have to keep in mind your client’s needs and wants while valuing their time. Your job is to initiate a relationship with your clients, and through your work, make that relationship long-term.
How about those client reports that you create every week, month, or quarter? Those are some of the most important parts of maintaining effective communication with your clients.
A great way of making sure that your client reports are on point is to make them engaging and helpful. Nobody has time to read a 10-page report ridden with boring text and statistics.
You have to make it worth their time. But how do you do that? By writing awesome reports that make your clients say ‘wow’!
Why Client Project Reports are an Integral Part of Communication Strategy?
Nobody wakes up thinking “I wish I could make reports for my clients all day”! We get it. Writing client reports is not very fun.
However, you and I both know that writing reports are part of the deal. Reporting involves talking with your client to understand their goals, and showcasing the data that closely relates to the said goals.
Whether the report is about quarterly earnings, sales, marketing performance, or updating the investors, reports help make sure that you are on the right path and help others understand how the business is developing.
1. Talk Results
Clients want to see reports to know how well their money is being spent. Thus tying together the data points which directly relate to the business goals of your client is the way to create an effective client report.

Reports act as a great opportunity for businesses to showcase their work, their capabilities, and dedication. They ensure clients that their work is in the right hands.
2. Reports Make Information Transparent
The glue that holds together any business relationship is transparency. Reports make the work of a business or a freelancer as transparent as it gets.
A report should directly state how your work affected the client’s bottom line and what went right or wrong! By being transparent in your work, you build an unmatched level of trust and credibility with your clients.
3. Project Reports Encourage Constant Interaction
Creating and discussing reports with clients forges constant communication and keeps everyone on the same side. Being in constant contact with your clients ensures you have a clear understanding of their goals.
Schedule weekly/monthly phone or in-person meetings with your client, talk with people from different roles within the organization and make notes of what they are trying to accomplish, what are their most important KPI’s and how they measure success.
4. Reporting Keeps Both Parties Accountable
By creating reports for clients and having regular meetings ensure that both the client and your business are on the same page.
Businesses are aware of the client’s needs and expectations, and at the same time, clients are educated on the work the business is doing to manage those needs and expectations; keeping both parties accountable for their part.
 Reporting not only keeps clients educated and informed about various aspects of your business, but it also keeps both parties on the same page as goals and expectations are measured.
Creating reports for clients may not be the most exciting thing you do today, but it doesn’t have to be the worst.
? Impress clients with clear, professional Project Status Reports—use this Free Template to get started.
Types of Project Reports You Can Create for Your Clients
There are various types of client reports that professionals need to create to show off their work to their clients. Some of these include:
1. Marketing Reports
Your marketing report can be sub-divided into various categories like- social media reports, Google Analytics report, SEO, SEM, SMO reports, organic traffic report, ad campaign reports, and so on.
Marketing reports are crucial for clients as they need to know they are getting a healthy return on their investment. Make sure to include the metrics and KPIs you agreed upon with your client before your campaigns.
This helps ensure that expectations are being met all along the way and leads to a healthy and long-lasting business-client relationship.
2. Social Media Reports
If you’ve been managing your client’s social media presence, your report should always the following key points:
- The number of Followers & Likes earned for the period
- Reach & impressions (how many people saw your content)
- Engagement rate (how people are interacting with your content)
- Conversions happening via social media
- Website clicks (people visiting your website from your different social media platforms
Avoid overwhelming your clients with analytics from all the social media platforms out there. If you can’t explain why a metric is important to a specific business goal, don’t include it.
Make sure to include engagement metrics from different social media platforms so that your clients know which are their top avenues for quality lead generation.
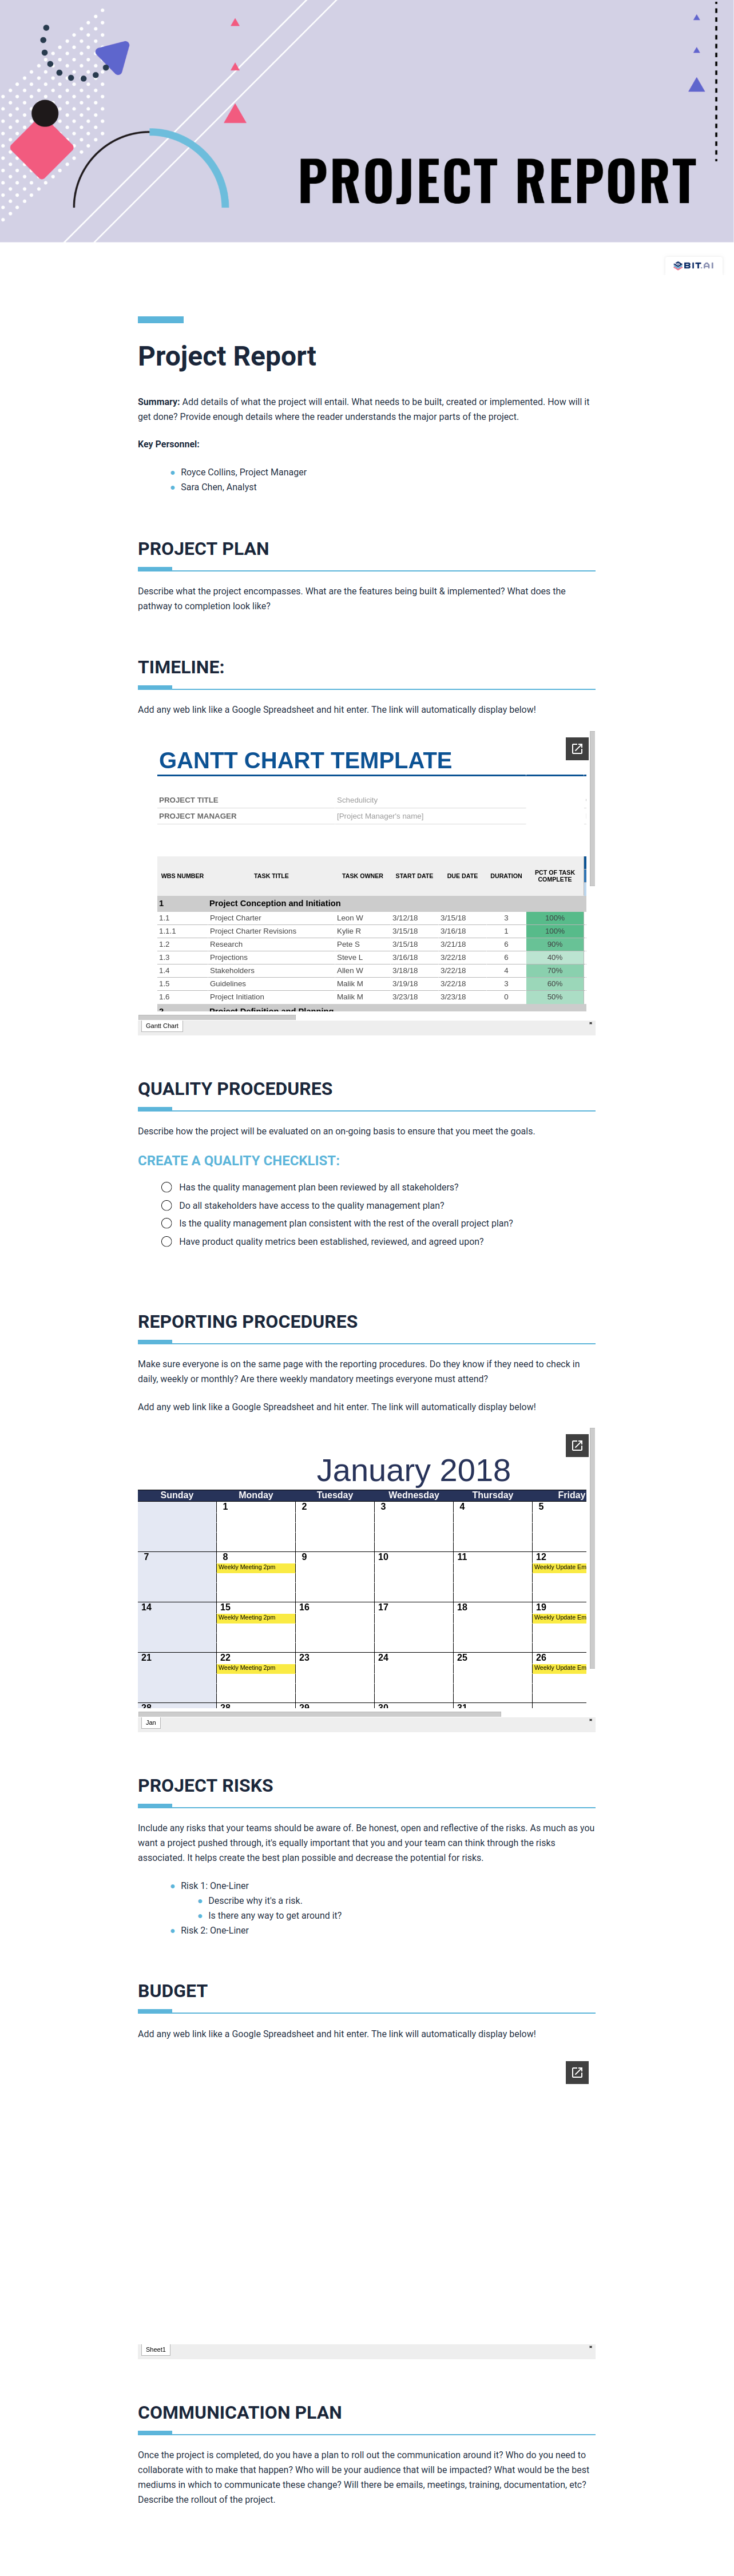
3. Project Status Report
The purpose of a project status report is to communicate the project’s current status to all stakeholders (clients, partners, etc).
This is where you tell your clients how the project is holding up, what milestones have been accomplished, and what challenges your team is facing currently.
 These reports can be delivered weekly, monthly, or quarterly depending upon the severity of the project and the challenges being faced by your business in accomplishing the project.
A project status report can include task progress, budget or change requests, issues or challenges being faced, milestones and deliverables, etc.
4. Research Report
In a research report, it is crucial for the researcher to not only deliver the findings but to also provide insightful interpretation of the results. A client isn’t interested in the research you carried out.
What they are looking for is the implications of the research and how can they put the research findings to good use.
For example, if you did market research for a client who wants to sell sneakers online, the report can include answers to questions like- what is the target demographic looking to buy sneakers online? What motivates them to buy a certain kind of sneaker? Why do they prefer certain brands over others and even more crucially? How can your client put this data to use?
5. Industry Report
An industry report is one that surveys and evaluates a given industry and the businesses involved in it.
The main purpose of an industry report is to find out the ins and outs of a particular industry and how your client can gain an advantage in an industry by understanding the industry players, target market, trends, and history, etc.
 Again, in addition to reporting all this essential data, proposing an action plan of how your client can use this knowledge and gain a competitive advantage would go a long way in fostering your client relations.
6. Investor Update Report
An investor update report includes all the updates, accomplishments, milestones, challenges, and numbers over the last month/quarter your investors need to know to get the sense of where the business is headed.
Make sure to make this report visually appealing and present all the data so that it’s easy to read and understand. Include links to your deck, cloud links, spreadsheet, analytics data, charts, etc. to give a complete overview of your progress.
Similarly, there are plenty of areas and topics that your client might want a report on. However, there’s one thing common in the creation of each and every one of them- it’s hard!
Gathering so much information, data, analytics, etc, organizing it seamlessly, adding awesome visuals, and create an overall interactive experience for your clients take a heck lot of time and energy.
So how do you take out the time from your crammed schedule and create awesome reports that your client wants to read? Don’t worry, we got you covered!
Read more: How To Create An Impressive Fact Sheet
Creating a client report that stands out!
If you are planning to send out a client report that looks exactly like any other boring report out there, chances are your client is just going to skim it along the way or either won’t read them at all.
Anyone can throw together a bland spreadsheet with columns marking results and numbers. But to really get your client’s attention and proudly display the work you have done for them, you have to make it irresistibly appealing!
Everybody likes reading something that is visually stunning and easy to grasp. It peaks reader interest by grabbing their attention and encourages them to read the whole thing.
Awesome visuals, accompanied by quality content, is the secret sauce to create better client reports. It’s time we say ‘no’ to boring, long reports full of text.
No more settling with your boring text editors and word documents. No more gray-scale spreadsheets. It’s time to make your reports come alive with rich media and provide a reading experience like never before!
Use Bit to create reports that wow your clients!
By now, you must be familiar with the importance of creating awesome client reports and maintain a healthy, ongoing relationship with your clients.
However, creating reports that have quality content as well as amazing design can be a bit of work.
Not anymore…
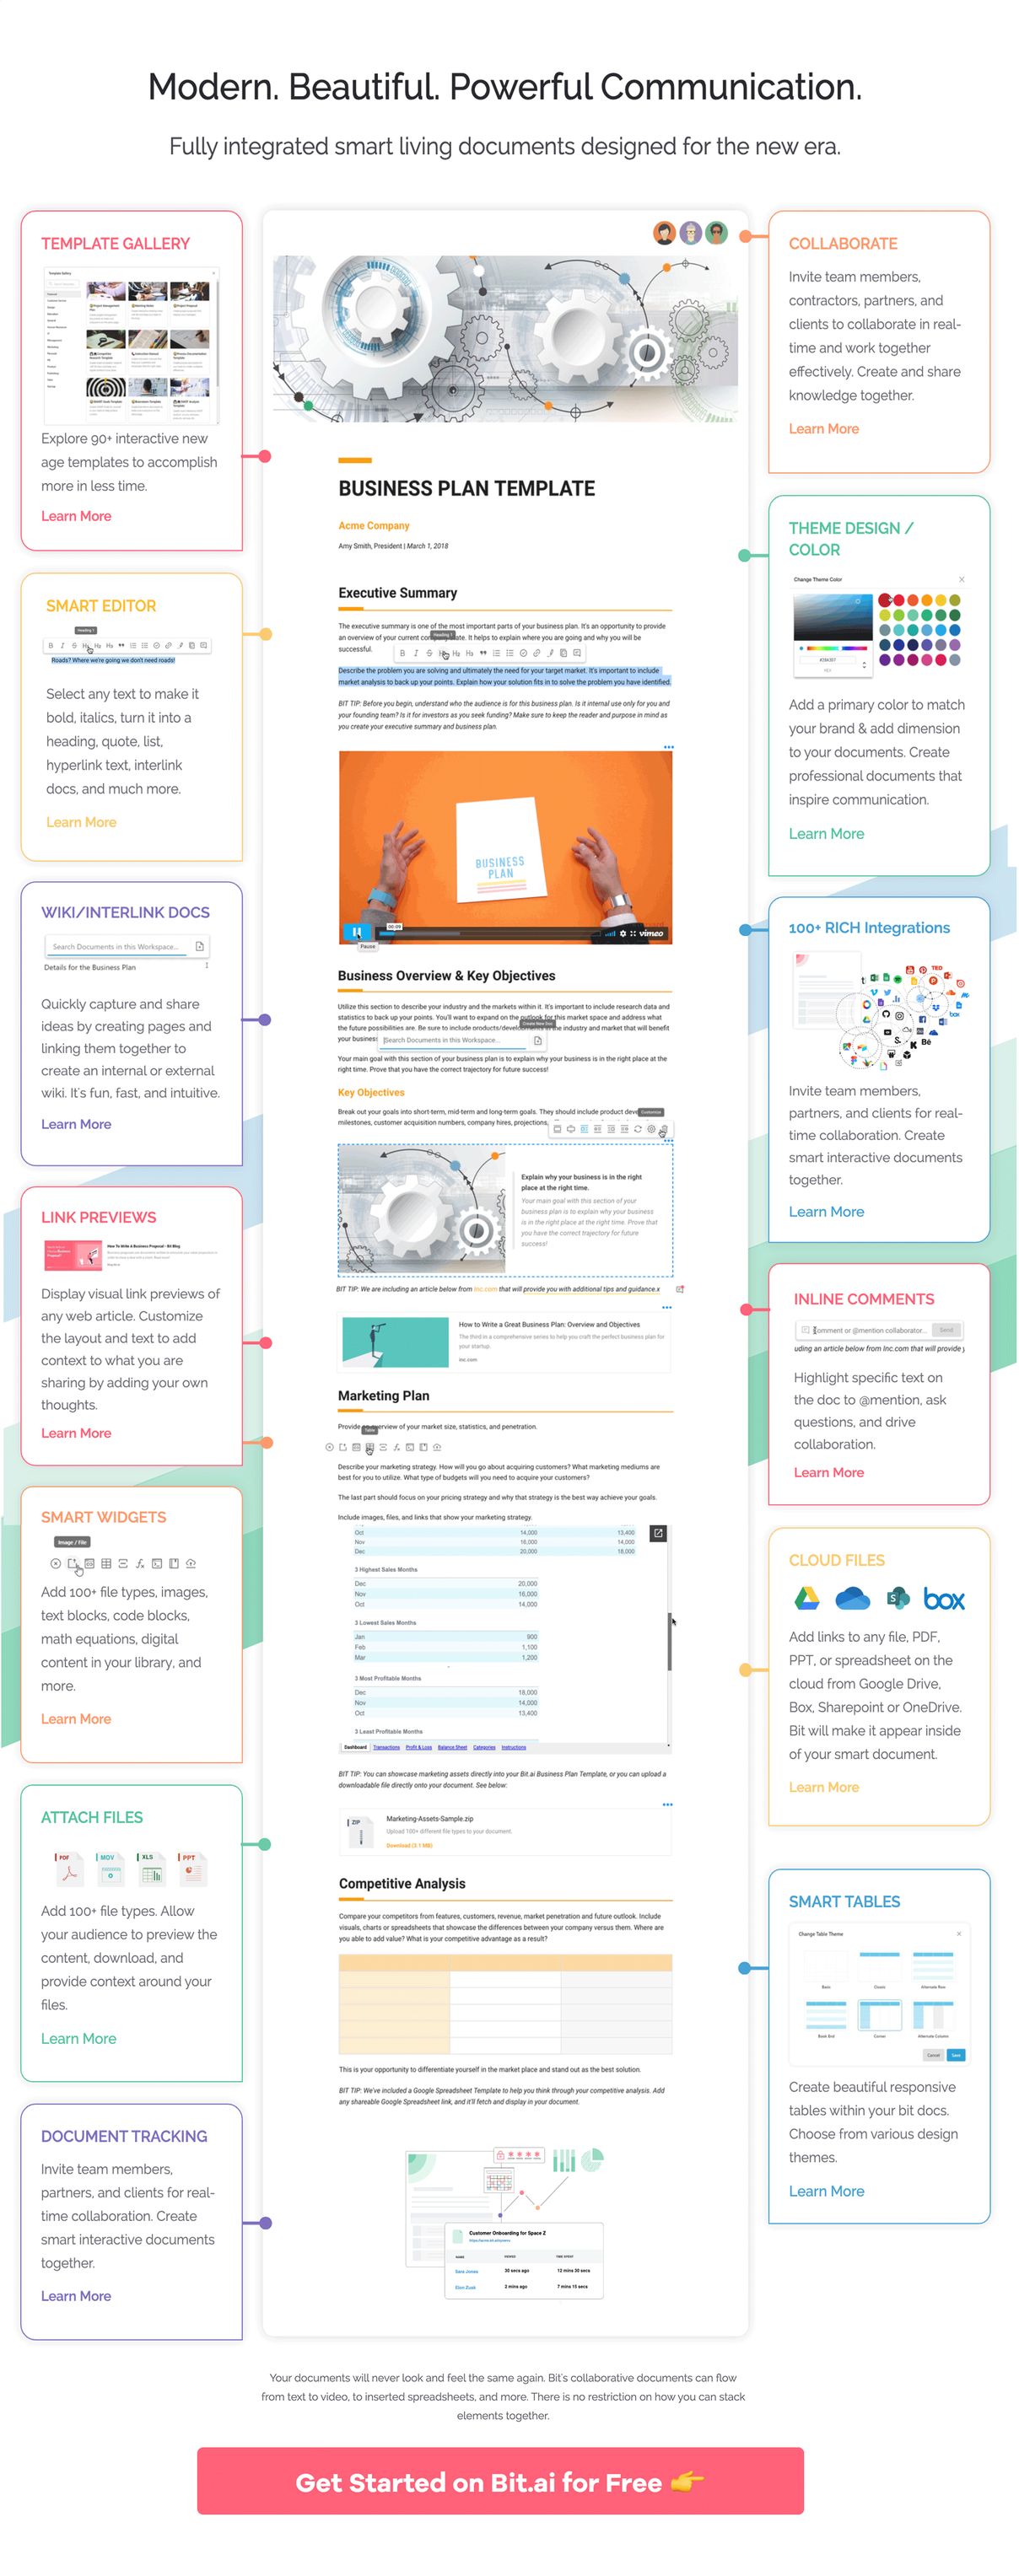
Bit is a new age cloud-based document collaboration tool that helps teams create, manage, and track workplace documents including reports.
Bit helps you make sure your reports are more than just plain boring text and images. Apart from allowing multiple users to collaborate on a report, Bit also allows users to share any sort of rich media like Google Docs, One Drive Excel Spreadsheets, GIFs, Tweets, interactive charts, polls, surveys, YouTube videos, etc.
Basically, anything on the internet with a link (i.e. www.example.com) can be shared and Bit will automatically turn it into live visual content inside your workplace documents!
Just copy-paste the URL of your content on a blank line of the document editor and hit enter. Bit then generates a live preview of your digital content within your document. Imagine how rich and interactive your reports can become.
Not sure how Bit can help you create that perfect report to woo clients? Let’s see some of Bit’s awesome capabilities!
Read more: How To Create Brainstorming Document the Right Way?
Why use Bit.ai for creating project reports?
1. Bring Your Staff Under One Virtual Roof
Creating a report from scratch takes a lot of time and effort. You have to research content, dig up the numbers, collect and organize a lot of data, come up with an outline, add awesome visuals, and design which is easy to read and understand for the client.
Doing this amount of work alone can be pretty daunting and time-consuming.
Bit allows you to work with your peers and create reports quickly and easily. Working in teams makes sure that you have all the correct data and double-check if something is missing.
Bit allows teams to collaborate together, give real-time feedback, suggest changes, and get work done quicker. Most importantly, say goodbye to back and forth emails.
2. Distraction-Free Editor
Bit has a minimal document editor which allows you to write your client reports without the distraction of unnecessary buttons and tabs.
However, it’s powerful enough to format your reports in any way you like. Bit’s smart formatting and simple, clean design mean you can create awesome reports without spending hours on it.
3. Create an Interactive Report
In this digital age, you need more than just text to engage your readers. Especially if you are trying to wow your clients, you need more than your ordinary reports to make your mark.
All the other document editors limit your creativity by only allowing you to incorporate text and static images in your document. Since reports are long-form professional documents, having to read so much text can be dull and ineffective.
This is why we empower you to add any type of rich media content, like Google Docs Spreadsheets, PDFs, presentations, polls, surveys, videos, etc. With Bit, you can create smart reports by incorporating hundreds of file types and making it dynamic and interactive.
4. Add Interactive Graphs
Charts and graphs are one of the best ways to represent data. Since client reports are all about data, express your data beautifully and effectively by adding interactive graphs and charts to your Bit report.
Just copy the web link of any shareable link for ChartBlocks or amCharts, paste it into a blank line in your Bit doc, and hit enter! Interactive graphs make the information you share really stand out.
5. Add Live Spreadsheets
Client reports, particularly marketing and social media reports, possess a lot of numbers and analytics which are often shared as a spreadsheet. With Bit, you can easily add those spreadsheets directly in your reports.
Just copy and paste the URL of your spreadsheet in your Bit doc and hit enter. Now you can easily review your reports and data with your peers and clients.
You can even interact with the spreadsheet as all modifications made to your spreadsheet will reflect in real-time on your Bit document. Easily share documents with prospects and clients by not overwhelming them with numerous attachments!
6. Add Social Content
Bit allows you to embed all types of social media content from Instagram posts, Facebook posts, Tweets, Pinterest boards, etc. directly in your Bit report or other workplace documents.
Make your clients go ‘wow’ with up-to-date likes, shares, comments, etc. directly from your report. They can click on the rich media embed and play videos, or go to the original post.
Keep your clients up-to-date with all your social media activities, findings, and research right from your Bit document.
7. Add Videos
Bit allows you to embed videos from any video-sharing platform like YouTube, Vimeo, Dailymotion, etc, directly in your Bit client report and play it right from your report!
Just copy the link of the video, paste it into your Bit doc, and hit enter! Share and get feedback on product videos, share inspiration from competitor advertisements, share product demos with your clients, and much more.
8. See how your reports performed!
Bit allows you to share your documents with your clients via a “trackable link”. This link gives you some pretty cool analytics. You can see who viewed your report, at that time, and how much time did they spend on your document.
One of the most interesting features, however, is the scroll ratio which tells you how far down your clients have scrolled your document.
This feature makes Bit all the more important. Imagine, you can track how far your report was scrolled and where your client loses interest. You can then make the changes accordingly.
Project Report Template
 Conclusion
Even though creating client reports may not be the most glamorous part of your business, but it sure is important.
It plays a huge role in determining your relationship with your clients and helps keep both parties on the same page. Creating reports shouldn’t be done as when you please. It’s should be done regularly, and effectively.
We, at Bit, have made it so easy for you to bring your team together and create reports easily. Bit empowers you to create interactive client reports by embedding data from your Google Sheets data, charts, and graphs from amCharts, YouTube videos, files from DropBox, surveys, and polls- basically anything on the internet with a link.
These reports are surely going to feel like a breath of fresh air to your clients, making you look professional and credible. So what are you waiting for? Go wow your clients with your reports, with a little help from Bit.ai!
So what are your thoughts on creating reports for clients? Do you enjoy it? Let us know in the comments below!
Further reads :
- How To Write A Project Proposal That’ll Get Approved In No Time( Template Included )
- Business Report: What is it & How to Write it? (Steps & Format)
- How to Create Quotations That Your Clients Can’t Reject?
- How to Write a Client Brief in 2022
- How to Write a Project Charter Document?
- How to Write a Request for Proposal (RFP)?
- Client Portals: Communicate with Clients the Right Way
- Technical Report: What is it & How to Write it? (Steps & Structure Included)
- How To Write An impressive Business One Pager
- How To Create An Effective Status Report?