Information is here. Information is there. Information is everywhere.
In a world that is crammed with information, how do you focus on the important ones? How do you separate the facts from the fiction? How do you ensure that what you get is free from any personal bias or views?
Whether you are in business or in academics or in any other field, and if you want to stay informed or make informed decisions, you need hard facts and objective informative details.
For that, you need informational reports.
An informational report is a factual document that presents information, data, findings, or updates without analysis, opinions, or recommendations. Its purpose is to communicate objective information in a clear and organized manner so readers can understand a situation, topic, project, or process.
Examples of informational reports include status reports, compliance reports, inventory reports, incident reports, and progress reports.
But, what are they? How important are they? Can you write one by yourself?
So many questions and we have all the answers right here in this blog. So without further ado, let’s get down to the basics of informational reports!
What is an Informational Report? (Definition)
An informational report is a factual document which provides information in an organized and objective way, without analysis or recommendations.
Basically, it’s all about reporting facts. So, it often includes data, details, feedback, or any other type of information about any topic or event.
One major element of informational reports is that they don’t contain any arguments. They are always objective and maintain a neutral position that is free from personal views or bias.
The purpose of these reports is to present detailed facts and inform the readers so that they can make a decision. Hence, the information inside an informational report is specific, complete, and relevant.
An informational report is usually read by officers, board of directors, and stockholders of a company, but depending on the contents of the report, it can be available or anyone in the company.
Common examples of informational reports include status reports, progress reports, compliance reports, incident reports, inventory reports, and operational reports.
Seems pretty basic, right? So, why are they important in a business? Let’s find out!
What Is the Purpose of an Informational Report?
The primary purpose of an informational report is to provide accurate and objective information to readers. Unlike analytical reports, informational reports focus on presenting facts rather than interpreting them.
Organizations use informational reports to:
- Share project updates
- Present operational data
- Communicate compliance information
- Document events and activities
- Provide status updates to stakeholders
- Maintain official records
Types of Informational Reports
Organizations create different types of informational reports depending on the purpose.
Common types include:
- Status Reports: Provide updates on ongoing projects or activities.
- Progress Reports: Track milestones, accomplishments, and completed work.
- Compliance Reports: Show whether regulations, policies, or standards are being followed.
- Incident Reports: Document workplace incidents, accidents, or unusual events.
- Inventory Reports: Track stock levels, assets, and materials.
- Financial Information Reports: Present financial data without offering recommendations.
- Operational Reports: Provide information about daily business operations.
Informational Report vs Analytical Report
Many people confuse informational reports with analytical reports because both present data and findings. However, their purpose is very different.
An informational report focuses on presenting facts, data, observations, and updates without offering opinions, interpretations, or recommendations. Its purpose is simply to inform the reader about a situation, event, project, or topic.
An analytical report goes a step further. It not only presents information but also analyzes the data, explains its significance, identifies causes or trends, and often provides recommendations for action.
| Feature | Informational Report | Analytical Report |
|---|---|---|
| Purpose | Present facts and information | Analyze information and provide insights |
| Opinion | No opinions or recommendations | Includes analysis and recommendations |
| Focus | What happened? | Why did it happen and what should be done? |
| Decision Making | Supports decisions with facts | Supports decisions with conclusions and recommendations |
| Examples | Status reports, inventory reports, compliance reports | Market analysis reports, feasibility reports, risk assessment reports |
Example
Informational Report:
“Website traffic increased by 18% during Q1. Organic search contributed 62% of total visits, while direct traffic accounted for 21%.”
Analytical Report:
“Website traffic increased by 18% during Q1 primarily due to improved search rankings and new content publication. To sustain growth, the company should continue investing in SEO and content marketing.”
In simple terms, an informational report tells readers what happened, while an analytical report explains why it happened and what actions should be taken next.
Top Benefits of Writing an Informational Report
1. Act as Medium Of Communication
In big companies, there is often a huge workflow that deals with multiple branches, departments, and teams. Any form of verbal communication often gets lost in that chain or network of people, which is why written reports are a crucial medium of communication for all.
Their main purpose is to communicate information to people and that is exactly what informational reports do because they aim to provide facts and details to all their readers. These are passed on from one person to another; thus, everyone is equipped with first-hand data.
2. Gathers and Organizes Data
An information report helps gather information about your company’s growth history, project details, and many other important areas. All of this information will be stored in a single place concisely and understandably for the people to access. It ensures that all data will be organized and designed in a standard format.

If this was useful, read this…
Top Risking Your Data – Build a Bulletproof Information Security Plan Now →
3. Provides Accurate and Objective Information
Nobody writes their personal opinion or views in an informational report because they are purely based on facts and accurate information or data which are taken at face value.
They are always neutral in their approach, which is why they do not contain any arguments and remain free from bias. Thus, these information reports always provide an accurate and objective picture of the subject or topic.
4. Facilitates Decision-Making
Since information reports provide a full factual picture of the subject or topics they present, it makes it easy for businesses to keep track of their revenues, expenses, operations, and other activities. All these data help management make decisions for the company.
There is communication, the flow of information, and interaction, all of which facilitate or pave way for decision-making within a company.
Now that you know the importance of informational reports, let’s take a look at the steps involved in making one!
Structure of an Informational Report
Most informational reports follow a standard structure:
| Section | Purpose |
|---|---|
| Title Page | Identifies the report topic |
| Executive Summary | Brief overview of key information |
| Introduction | Explains the purpose and scope |
| Main Body | Presents facts, findings, and data |
| Visuals | Charts, tables, or graphs supporting the information |
| Conclusion | Summarizes the key findings |
| References | Lists sources used |
| Appendix | Additional supporting information |
A clear structure makes the report easier to read and helps readers quickly locate important information.
Informational Report Format
A simple informational report format looks like this:
Title
Executive Summary
Introduction
Background Information
Findings
Data and Evidence
Conclusion
References
The exact format may vary depending on the organization, industry, or academic institution, but most informational reports follow this general layout.
How to Create an Informational Report? (Step-by-Step Guide)
Do you need to share clear and concise information on a particular topic? Informational reports are a powerful tool for presenting factual data in a well-organized way. They are used in a variety of settings, from classrooms to workplaces, to convey knowledge on almost any subject.
This guide will walk you through the key steps involved in crafting an effective informational report. By following these steps, you’ll learn how to structure your report, conduct thorough research, and present your findings in a way that is informative and engaging for your audience.
Step 1: Start With Introduction
Ever started reading a report and gotten bored right away? Let’s avoid that! The introduction is your chance to make a good first impression and get your reader excited to learn.
Here’s how to craft an introduction that grabs your reader’s attention:
- Hook ‘Em In! – Start with a bang! Use a question, a surprising fact, or a short anecdote related to your topic. For example, if your report is on honeybees, you could begin with: “Did you know a single bee can visit up to 100 flowers in one trip?” This piques the reader’s curiosity and makes them want to learn more.
- Introduce the Player: Your Topic! – Clearly state the subject of your report. This lets the reader know exactly what they’re about to dive into. Keep it simple and avoid overly complicated words.
- Give a Sneak Peek: What They’ll Learn! – Briefly mention the main points you’ll cover in the report. This gives the reader a roadmap and helps them understand what to expect.
- Thesis Statement: The Big Picture! – In one clear sentence, summarize the main idea of your report. This is like the central message you want your reader to remember.
Remember to keep it concise! Your introduction should be just a few paragraphs long.
Step 2: Include the Main Body
We’ve got the introduction out of the way, now it’s time for the main event: the body of your report. This is where you dive into the details and share all the interesting information you’ve gathered about your topic. Here are some tips to make your report’s body informative and easy to follow:
- Headings are Your Friends: Break down your main points into clear headings and subheadings. Imagine them as signposts, guiding your reader through the different sections of your report.
- Organize Your Information: Think about the logical flow of your information. Does it make sense to discuss the history first, then the different parts, and finally how it works?
- Use Examples and Facts: Don’t just tell, show! Use real-life examples, statistics, or interesting facts to illustrate your points and make the information come alive for your reader.
- Explain Technical Terms (if needed): If you’re using any technical terms your audience might not know, take a moment to explain them in simple language.
- Bullet Points and Tables: Bullet points and tables are great for presenting lists or data in a clear and concise way. They make it easier for your reader to understand complex information at a glance.
Here’s an Example:
Let’s say you’re writing a report on honeybees. In your body section, you could have headings like:
- The Importance of Honeybees (Explain their role in pollination)
- Life Cycle of a Honeybee (Break down the different stages with explanations)
- Threats Faced by Honeybees (List the challenges they face)
Under each heading, you would then use clear language, examples, and maybe even a simple diagram of a beehive to explain each point.

Create Clear, Professional Reports with Bit.ai
Turn complex information into well-structured reports. Collaborate, organize insights, and create polished documents with ease.
Free to start • Set up in minutes
Step 3: Use Visual Elements
Visual elements like charts, graphs, pictures, and even maps can make your informational report way more interesting and easier to understand.
Here’s how to use visuals effectively:
- Pick the right picture: Don’t just throw in any random image. Choose visuals that directly relate to the information you’re explaining in that section of your report.
- Charts and graphs for numbers: Numbers can be hard to remember, especially in big chunks. Charts and graphs like bar graphs, pie charts, or line graphs can make those numbers come alive and show trends or comparisons easily.
- Tables for clear organization: If you have a lot of information with categories, like different types of something and their details, a table is a lifesaver. It keeps things neat and organized, making it easy for readers to find specific details.
- Pictures for real-life examples: Sometimes, a picture is worth a thousand words! If you’re explaining a process or an object, a clear picture can help readers understand exactly what you’re talking about.
- Maps for location, location, location: If your report is about a place or how something moves around, a map can be super helpful. It can show where things are happening or where something comes from.
Step 4: Write a Conclusion
The conclusion is like the closing statement of your report. It’s your chance to remind the reader of the key things you covered and leave them with a final thought. Here’s how to write a strong conclusion:
- Briefly Summarize Your Main Points: Don’t rewrite everything, but pick the 2-3 most important points you discussed in the body of your report. Briefly remind the reader what they learned.
Example: “This report explored the different types of dolphins, their habitat, and how they communicate.”
- Restate the Importance of Your Topic (Optional): Why is this information important? Remind the reader why this topic matters in a simple sentence or two.
Example: “Understanding dolphins helps us protect these fascinating creatures and their ocean homes.”
- Avoid Introducing New Information: The conclusion is for wrapping things up, not adding new details.
- End with a Final Thought (Optional): You can leave the reader with a thought-provoking question or a simple statement that ties back to your introduction.
Example: “Perhaps future research will help us unlock even more secrets about these intelligent animals.”
- Keep it Short and Sweet: A good conclusion should be just one paragraph long.
Step 5: Include Glossary and Bibliography
You’ve written a fantastic report packed with information, but there are two final steps to make it even better: a glossary and a bibliography. These might sound fancy, but they’re actually quite simple!
Glossary: Here’s how to build it
- Pick the Right Words: Go through your report and highlight any words that are technical, uncommon, or specific to your topic.
- Define Clearly: Write down each highlighted word in alphabetical order. Then, in a sentence or two, explain what the word means in simple terms.
- Example: Let’s say you wrote a report about robots. In your glossary, you might have “Bipedal (adjective): Walking on two legs, like a human.”
Bibliography:
- List Your Sources: Write down every book, website, article, or interview you used for your research.
- Follow a Format: There are different ways to format a bibliography, but a common one is MLA (Modern Language Association) style. You can find free MLA format guides online.
- Example: Here’s an example of an MLA formatted source for a website: Author’s Last Name, First Name. “Title of the Webpage.” Website Name, Date published, URL.
Step 6. Proofread Your Informational Report
Now that you have completed the entire writing process, the only thing left for you to do is to proofread and ensure that all your facts and data are accurate and free from personal bias. Look for spelling errors, grammatical mistakes, inconsistencies in punctuations, and check whether your sentences are properly structured.
Seems easier than you expected, right?
But wait! What if we told you we could make writing informational reports easier than it already is with just a few clicks?
Don’t believe us?
Then scroll down to see how!
Informational Report Examples
Example 1: The following example shows how an organization might report employee training activities during a specific reporting period.
Title: Employee Training Completion Report
Reporting Period: January–March 2026
Introduction
This report provides information on employee training activities completed during the first quarter of 2026.
Findings
- 120 employees participated in mandatory compliance training.
- 95% of employees completed all required courses.
- Customer service training was completed by 45 employees.
- Technical skills workshops were attended by 30 employees.
Conclusion
Training objectives for the quarter were successfully achieved, with most employees completing the required programs within the scheduled timeframe.
Example 2: This example demonstrates how a library can present usage statistics and resource circulation data in an informational report format.
Title: Library Usage Report
Reporting Period: March 2026
Introduction
This report presents information regarding library usage and resource circulation during March 2026.
Findings
- 3,250 visitors accessed the library during the month.
- 1,870 books were borrowed.
- Digital resource usage increased by 18% compared to the previous month.
- The most borrowed category was business and management books.
Conclusion
Library usage remained strong throughout the reporting period, with steady visitor engagement and consistent borrowing activity.
Bit.ai: Ultimate Tool to Create All Types of Reports

Gone are the days you spend hours on your computer trying to fix and align your reports and projects because technology has simplified our lives so much that all it takes is a few minutes and a few clicks for completing any task!
Yes, but how is this possible?
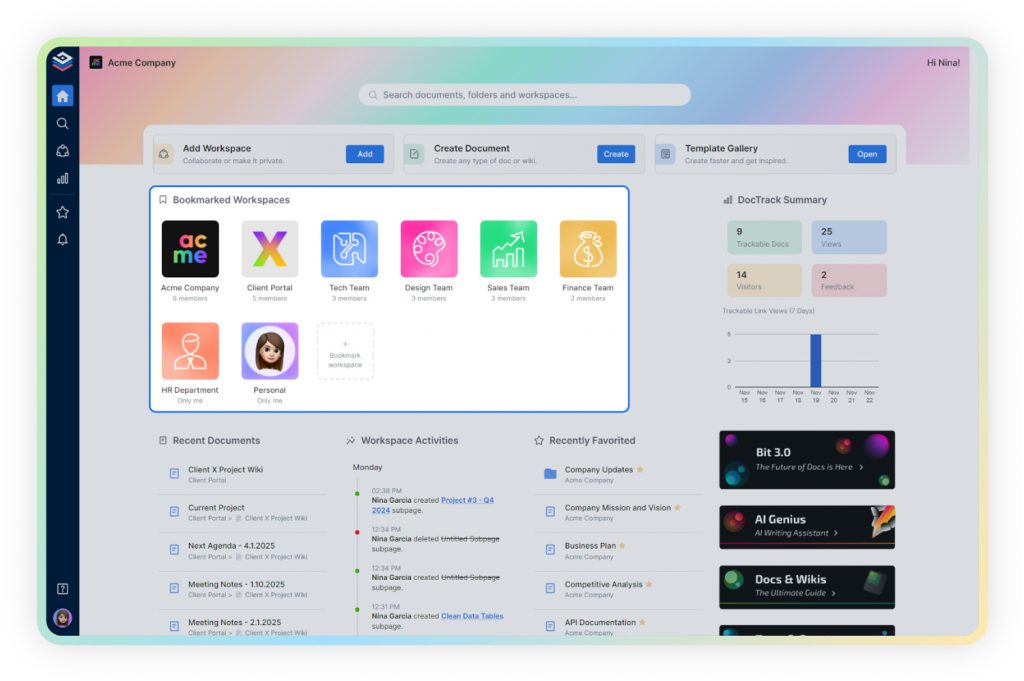
We present to you Bit.ai, a cloud-technology-based document collaboration platform that helps you create modern, digital integrated documents effortlessly.
… and it’s a boon for your informational reports! How?
Take a look at these features of bit.ai!
1. Document Templates
What if we tell you that the entire structure of your information report is already done and designed for you? That’s because Bit has an extensive template gallery that provides you with over 70+ ready-made templates from which you can choose your favorite! This basically means that you have a template for your informational report just waiting to be used. All you have to do is insert your text in a pre-formatted document and customize it wherever it is required! You no longer have to worry about how your document will look, just focus on your content!
2. Auto-Formatting

In addition to the amazing templates that Bit provides you, it automatically formats all your documents even if you don’t! You don’t have to bother about the margins, line spacing, numbering, and fonts of your document because Bit has a minimalistic design that ensures everything is uniform and neat. This saves you a lot of time and effort!
3. Supports 100+ File Formats

Want an easy way to include visual elements in your informational document? Then Bit is the perfect tool for you, because it supports multiple file formats and lets you seamlessly add videos, maps, charts, tables and so much more onto your document within a few seconds! Its smart integration allows you to add rich media elements like weblinks, pdfs, embeds, math equations, graphs, and make your informational report highly engaging!
4. Multiple Workspaces
There is a lot of information and people involved in the creation of an informational document, and sometimes it can become chaos. But not with Bit around, because it lets you create infinite workspaces and folders around projects and teams to keep all your work organized. This lets you store all your information in a neat and orderly manner so that you can create informational reports much more efficiently.
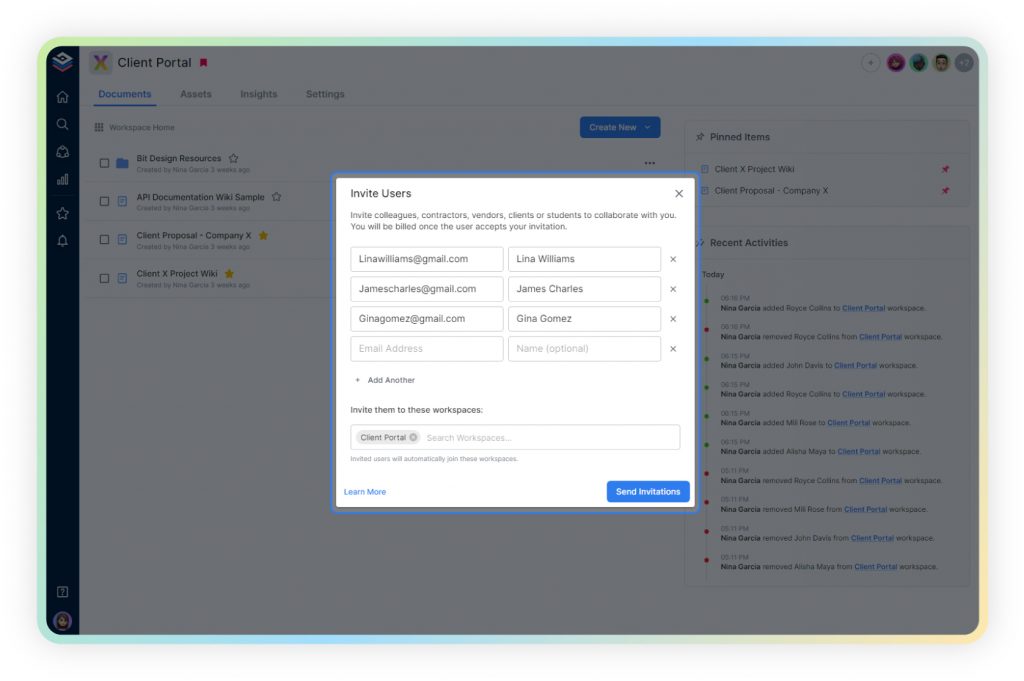
5. Real-time Collaboration
Bit’s has a real-time collaboration feature that allows you to invite people from multiple teams and departments to join you and work together in real-time to prepare information reports. You can edit, add comments, high to add collaborators who can proofread or edit your work.
You have to admit, Bit is the whole package deal for writing reports! It will definitely change the way communicate and create information!
So what are you waiting around for? Get Bit and enjoy an easier and smoother life!
Our team at bit.ai has created a few more templates to make your business processes more efficient. Make sure to check them out before you go, your team might need them!
Looking for more templates?
Check out our latest complete collection of ready-to-use professional templaes
Free to start • Set up in minutes
Conclusion
Informational reports help businesses, educational institutions, and organizations communicate facts clearly and objectively. Whether you’re preparing a status report, compliance report, inventory report, or project update, following a structured format ensures your information is easy to understand and reliable. By focusing on facts rather than opinions, informational reports provide readers with the information they need to stay informed and make better decisions.
FAQs
What is an informational report?
An informational report is a document that presents clear, factual details about a topic without including personal opinions or recommendations. Its goal is to communicate data, findings, or observations in a straightforward way so readers can easily understand and use the information.
Why do businesses use informational reports?
Businesses rely on informational reports because they offer clarity and consistency. When everyone has access to the same set of facts, there’s less confusion and fewer assumptions. These reports help teams understand current conditions, identify areas that need attention, and make more informed decisions.
What should I include in an informational report?
Keep it simple and structured. Start with a brief introduction, use clear headings, and present only accurate, reliable information. Include charts, tables, or visuals if they help make the data easier to interpret. Stay neutral throughout—focus strictly on facts, not personal opinions.
What makes an informational report different from an analytical report?
An informational report provides facts.
An analytical report adds interpretation, reasons behind the facts, and recommendations.
If your goal is only to present what you found – without analysis or suggestions – an informational report is the right choice.
Why should I write an informational report instead of a regular essay or email?
Sometimes, people need straightforward facts without extra explanations or storytelling. An informational report organizes everything in one place – what you found, what the data shows, and the current situation. It’s easier for teams and managers to skim, understand, and use the information without guessing or reading between the lines.
Can an informational report include recommendations?
No. Informational reports are designed to present facts, data, and observations without recommendations or opinions. If a report includes analysis, conclusions, or suggested actions, it becomes an analytical report rather than an informational report.
Keep reading & learning
- Master Project Reports Like a Pro (Even If You’re a Beginner!) →
- Periodic Report: What is it and How to Create It? →
- Weekly Report: What is it & How to Create it? (Steps & Structure) →
- Performance Reports: Importance, Essential Elements & How to Create Them →
- Fact Sheets That Wow: How to Create One in Minutes (Template Inside!) →