“Hi there! How are you doing, dear readers?”
As people, we can easily answer that question in a few sentences. But when it comes to a business, the answer is found in a performance report.
Performance reports provide a clear snapshot of how a company, team, or individual is performing, utilizing key metrics, data, and performance measures. Whether it’s work performance reports, school performance reports, annual reviews, or monthly updates, this guide covers everything you need to know.
Performance reports are important tools. They assist companies in keeping track of the progress made, strengths and weaknesses, and make sound decisions. Be it the sales figures, employee output, or milestones of a project, a properly designed report gathers all the important information in a single location that is easily comprehensible.
Getting comfortable with creating and analyzing performance reports will give you a deeper insight into your business operations. It helps you spot trends early, celebrate successes, and course-correct where needed. Ready to become a pro at performance reporting? Let’s jump right in!
What is a Performance Report?
A performance report is simply a method of checking the performance of a company. It compiles important information, such as project status, group or individual performance, and business performance. The idea is to determine how the company is getting to its targets, and to identify what works and what may need a little polishing.
These performance reports can focus on:
- Projects (e.g., progress reports)
- Teams (e.g., team performance reports)
- Individuals (e.g., employee performance reports)
- The entire business (e.g., business performance reports)
Simple enough, right? Now, let’s try to understand why performance reports are important for business management and development!
Importance of Creating Performance Reports
The reason performance reports are important is that they give a very clear and organized perspective on business performance. They consist of quantifiable information that they use to monitor their progress, strengths, and weaknesses. This helps teams make correct decisions and be focused on achieving their goals.
1. Benchmarking
Benchmarking is used in performance reports to set and measure targets. It compares the performance of your business against other competitor companies and helps you identify areas where you are underperforming and outperforming, so that you have an understanding of where you stand in the industry.
Benchmarking eliminates guesswork and provides solutions to specific problems. It provides you with essential data needed to analyze and discover new opportunities. So, basically, benchmarking helps improve your efficiency and productivity while also enhancing customer satisfaction!
Read more: 10 Top Performing Business Metrics Your Business Must Know About!
2. Workforce Monitoring
A performance report covers everything, including your employees’ performance. It helps you define the performance of your workforce: how well your employees are doing, and where improvements can be made.
The report measures the customer satisfaction surrounding your team as well. This not only helps the employees improve their performance, but also helps in the overall expansion of your business!
3. Prepares External Reports
Since businesses are required to comply with reporting regulations and laws, they need to produce other external reports, such as annual reports, financial statements, accounts, etc. Performance reports assist in the preparation of these external reports!
4. Enhances Business Performance
A performance report provides you with real-time information about your business. This information can be used to identify areas of strength and weakness so that you can bring in changes and improvements by reshaping the strategies and methods used within your company.
This is a great way to enhance your business performance. With these reports, you can set realistic and achievable targets that help in improving employee morale and will also help increase overall performance and productivity.
5. Enhancing Communication
With a performance report, you can understand your employees and their performance levels. It also provides customer insights and helps you understand the needs of your consumers. By having a better perception of your employees and customers, you will be able to communicate with them effectively.
This will ensure a smooth flow of information inside the company, thus reducing confusion and other workplace conflicts. As a result, there will be improved team energy and morale!
What to Include in a Performance Report?
To ensure that your performance reporting works, the following is what you should include in your document:
1. Executive Summary
A executive summary of performance at the high level, including important findings and trends. It allows the stakeholders to grasp quickly the general insights without being immersed in the data.
2. Mission and Objectives
This section clearly states the long-term objectives and the strategic vision of the company or project. It is used as a point of reference to measure performance and to bring all the activities in the company into focus with the overall intention and expected results.
3. KPIs and Performance Metrics
Focus on measurable data points that indicate success. These can include sales figures, customer retention rates, productivity measures, or other quantifiable indicators that track progress toward objectives.
4. Assessment by Category
Breaks down performance into specific areas, highlighting which segments are strong, which are performing adequately, and which need improvement. This allows targeted action and resource allocation.
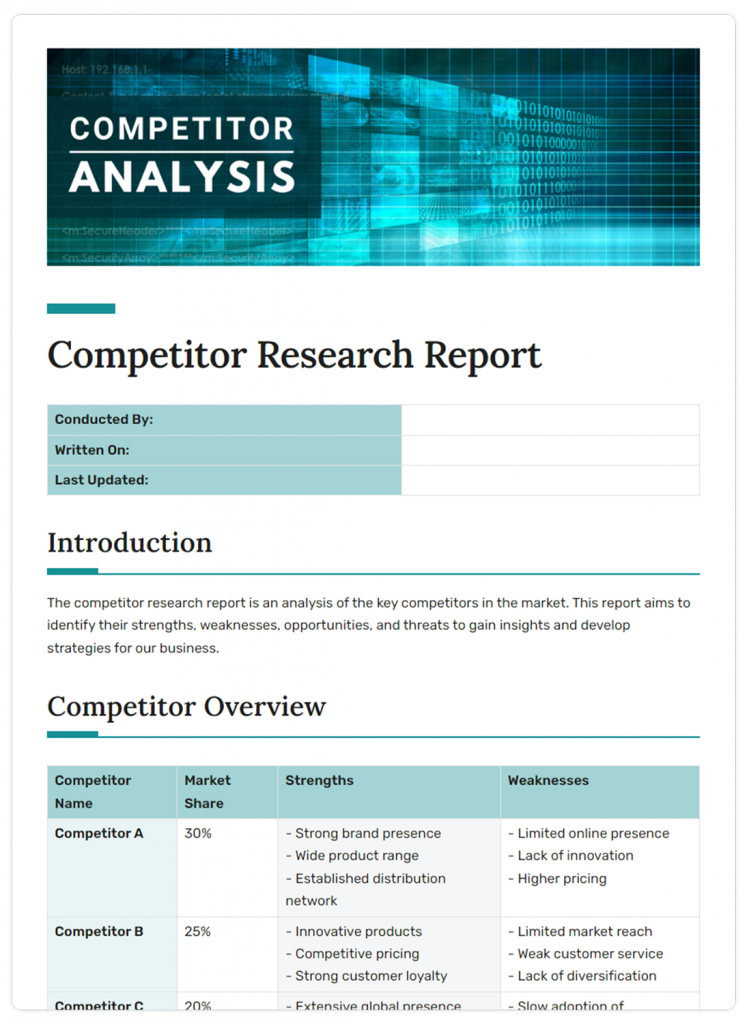
5. Comparative Analysis
Compares performance metrics with competitors and industry standards to provide context. It tells us the position of the company in the market and also pinpoints the opportunities or threats as per the external yardstick.

6. Visual Elements
Incorporates graphs, charts, and tables to illustrate trends, patterns, and relationships in the data. The images help make complex information simple and make decisions faster.
7. Recommendations for Continuous Improvement
Offers actionable insights based on the report’s findings. This section suggests strategies, changes, or initiatives to enhance future performance and address any identified weaknesses.
8. Appendix or References
Includes source data, detailed calculations, and supplementary information that support the main report. It provides transparency and allows readers to verify the accuracy of the analysis.
Now, let’s see how to create a performance report.
How to Create a Performance Report in Easy Steps?
Here are the steps involved in writing a performance report for your business:
Step 1. Keep the Audience in Mind
The first step toward creating an effective performance report is to keep your target audience in mind. Your performance report is mainly written for the senior management, but it is also used by employees.
Consider their needs for wanting a performance report before you start drafting it. Ask yourself these questions:
- Who is your target audience?
- What do they want – a general or a specific performance report?
- Is this performance report useful for them?
Step 2. Define Mission and Objectives
Once you are clear about your target audience, you must lay down what you aim to achieve. Define your organization’s mission and determine your company’s goals and objectives.
For example, if you run a clothing company, then your mission could be to become the largest clothing retailer in your city, and your objectives could be to increase sales and revenue.
Doing this will help you evaluate and measure your company’s performance against your missions and objectives and see how well you are doing in terms of achieving or meeting your goals.

Step 3. Start with an Executive Summary
Start your performance report by writing an executive summary that gives an overview of your business’s performance in all aspects of its operations.
It basically acts as a snapshot that contains a brief and concise form of the information that your report will discuss. It provides a synopsis of your company’s growth.
Step 4. Provide the Performance Assessment
Once you write your summary or synopsis, you move on to the actual assessment of your business. This section breaks down each part of your business by evaluating all the major KPIs and metrics involved in measuring your results.
To show how well you performed, you can divide things into 4 categories, namely – Strong, Good, Fair, or Weak – which can help you focus on specific areas for improvement.
Here are some other things you can include in this section:
- Financial Status of Company:Assess the state of cash flow and revenue generation
- Industry Comparisons: Compare KPIs and metrics of competitors to illustrate how well your company is doing in the market.
- Non-Financial Quantitative Data: Examine the percentage of product rejects, volume of sales, number of complaints, etc.
- Non-Financial Qualitative Data: Mention changes in reputation, effectiveness, customer satisfaction, staff morale, etc.
Step 5. Include Visual Elements
Visual elements make your reports more engaging and easy to understand, which is why they are a crucial part of performance reports. By visual elements, we mean including tables, charts, graphs, etc.
In your performance report, you can include a graphical trend analysis section that summarizes your KPIs over a certain period of time, in a graphic form. This will show any trends or patterns that might exist for your company in comparison to other companies.
You can also include a section for detailed statistical tables to present your figures and ratios, and measure them along with other companies in your industry.
Step 6. Proofread
The last and final step in creating any report is to proofread it. The same applies to performance reports.
Look for spelling errors, grammatical mistakes, and inconsistencies in punctuation, and check whether your sentences are properly structured. Ensure that the data you have presented is accurate and up-to-date.
That’s pretty much it! Once you complete all these steps, your performance report is ready to go.
Before you go, we’d like to let you in on a little something that can make creating performance reports as easy as a breeze. That’s right! A tool that will help you save a lot of time and effort!
Don’t believe us? Then scroll down right now!
Bit.ai: The Best Tool for Creating All Types of Reports
Bit.ai is the smartest AI-powered documentation platform for simplifying performance report creation and more. Bit.ai takes the hassle out of writing business reports, monthly summaries, and school reports with its robust AI Doc Builder and AI writer to assist you. Its AI Genius tool has been the best, enabling you to generate smooth and insightful documents more quickly, with content, formatting, and design suggestions.
Bid farewell to spreadsheet headaches, as everything is well-organized in a clean and efficient workspace with Bit.ai! Here’s why Bit.ai is an ideal choice for creating business reports.
✔️ Extensive Report Templates: Choose from professionally designed templates tailored for business, monthly, school, and more, speeding up your report creation process.
✔️ AI Doc Builder: You can use the AI Doc Builder to create a performance report in minutes. Want to know how? Read on.
Create Professional Performance Reports Effortlessly with Bit’s AI Doc Builder
With Bit.ai’s AI Doc Builder, crafting a performance report is much simpler than you can even imagine. You just have to search “performance report”, fill in your data in the form, answer 2-3 questions, and boom, a clear, professional report is ready to use.
It’s so simple, thanks to Bit.ai, an amazing tool that makes performance reporting smooth, fast, and stress-free.
And Bit.ai doesn’t stop there—it also comes packed with powerful features to make your reports stand out.
✔️ Maintain Design Consistency: Maintain uniform styles and formatting across all documents without lifting a finger, ensuring a professional look every time.

✔️ Rich Media Embedding: Easily embed dynamic content such as live charts, KPIs, dashboards, videos, and spreadsheets directly into your reports for real-time data visualization. Bit.ai works with 100+ popular applications so their content can live inside of your documents.
✔️ Real-Time Team Collaboration: Work simultaneously with colleagues, leave comments, and track changes to keep everyone on the same page and speed up the review process.
✔️ Organized Workspace: Keep your documents neatly organized with folders and workspaces, making it simple to locate and manage all your reports in one place. So, visit Bit.ai today and see how its AI-powered system can make your performance reporting a smooth and efficient process rather than a tedious one.
Wrapping Up
A performance report is not a mere summary. It is a powerful tool to examine and polish everything in your business. Your business can also unlock its potential by monitoring progress and trying to continually improve, and paying close attention to the key performance measurements.
Bit.ai simplifies this process and makes it more efficient thanks to its advanced features and capabilities powered by AI. Not only does it assist you in writing well-organized reports in a very short time, but it also makes your papers clear and attractive to read. Bit.ai allows transforming complex data into usable information more easily than before.
When it comes to annual reviews or quick performance updates, Bit.ai is the smart, well-organized platform you need for creating intelligent and impactful reports.
It’s time to start crafting your next masterpiece report with Bit.ai!
FAQs
1. How is the employee performance report different from the team performance report?
Team reports measure group results and cooperation, whereas employee reports concentrate on individual performance.
2. What are the various forms of performance reports?
Some examples are annual performance report, monthly performance report, school performance report, and work performance report.
3. Why is an employee performance report needed?
To analyze and monitor the growth/ development of an individual, his/her contributions,/their area of improvement in the company.
4. What will be an example of a performance report?
A sales report with key performance indicators, customer reviews, and significant employee achievements is to be produced each month.
5. What is the flow of a performance report?
Begin with an executive summary, then list goals and KPIs, visual insights, performance analysis, and improvement recommendations.
Keep Reading & Learning ?
- Key Performance Areas (KPA) Simplified: Types, Benefits & More!
- Top 10 Key Performance Indicators You Need To Measure
- 9 Ways to Improve Work Performance