What if creating an organizational chart felt as simple as telling your team’s story?
Imagine this. When you map out your team structure, you don’t have to struggle with disorganized boxes and convoluted reporting lines—everything falls into place in a matter of seconds, with no formatting issues. You don’t have to guess where a role fits. No constant revisions. Just a clean visual that unfolds in front of you like a cinematic moment when everything suddenly makes sense.
That is what AI-powered org chart tools are making possible for teams all over the world. You are no longer limited to slow, manual chart building. You now have assistants who understand hierarchy, visualize structure, and help you create polished charts that are easy to update and share.
Now that you know what is possible, let’s move into why organizational charts matter so much in the first place.
What is an Organizational Chart and Why Does it Matter?
Have you ever seen a team that grows very quickly and asked yourself how everything is kept together? Who reports to whom, which roles drive which outcomes, or how responsibilities flow across departments? That is precisely the clarity an organizational chart gives you.
An org chart shows the heartbeat of your company structure. It helps everyone understand hierarchy, decision paths, and collaboration lines. Your org chart is like a map for your team, whether you’re bringing on new people, expanding to new places, or just trying to make daily communication clearer.
A good org chart also makes work easier by letting people quickly find the right person for a task or approval. This cuts down on delays and makes everything flow better.

If this was useful, read this…
Different Types of Organizational Chart Layouts You Should Know
Not every organization tells its story the same way. That is why organizational charts come in different layouts. Each one reflects how teams are structured, how decisions flow, and how responsibilities are divided. Choosing the right layout is just as important as choosing the right tool.
Here are the most common organizational chart types you will see in modern teams.
1. Hierarchical Org Chart
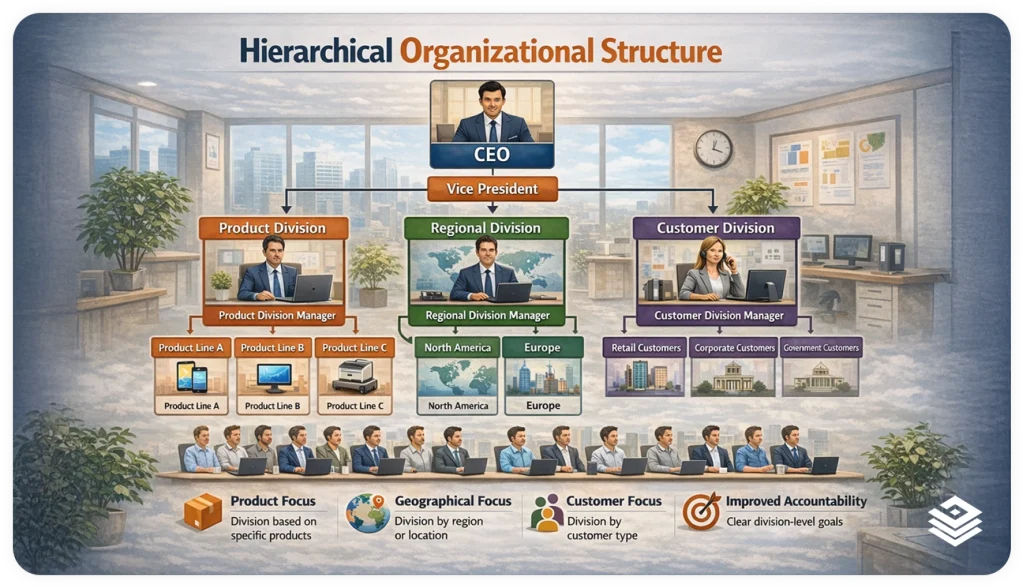
It follows a typical top-to-bottom structure. The leadership occupies the top position, then the managers are placed after them, and the team members are placed below them.
It is really effective for organizations that have clear reporting lines and formal management setups.
Large companies, government institutions, and manufacturing firms are often the ones that use this.
2. Flat Org Chart

Flat structures minimize the number of management levels. The staff communicates directly with the top management or small groups of managers. This layout promotes faster communication and flexibility, but it can become difficult to scale as the company grows.
Startups and creative teams often prefer this style.
3. Matrix Org Chart
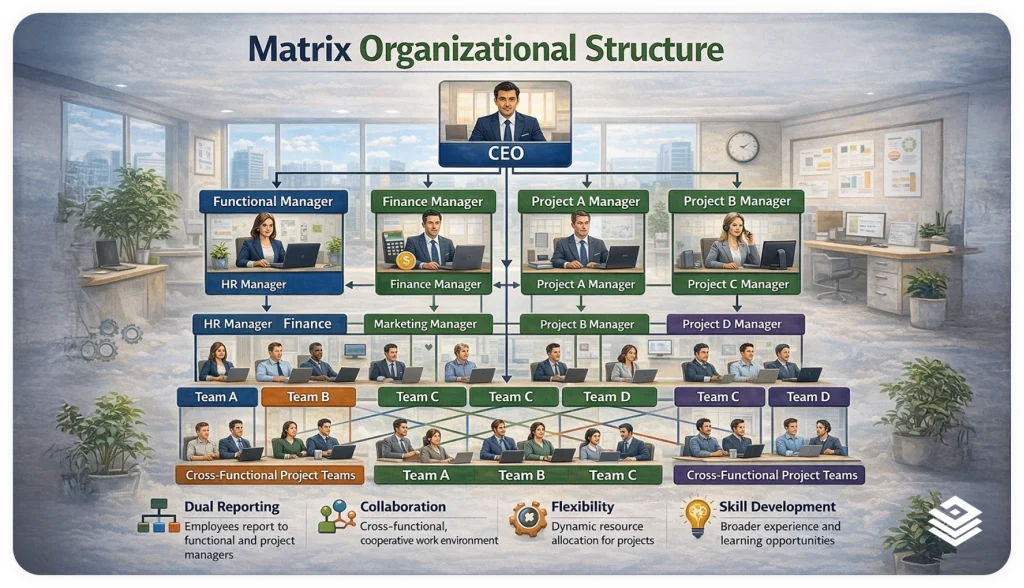
In a matrix organizational structure, an employee will usually have multiple reporting points, typically a functional manager and a project manager. This arrangement facilitates interdepartmental teamwork but may seem overly complicated if the roles and responsibilities are not clearly defined.
Technology and consulting companies commonly use this approach.
4. Divisional Org Chart
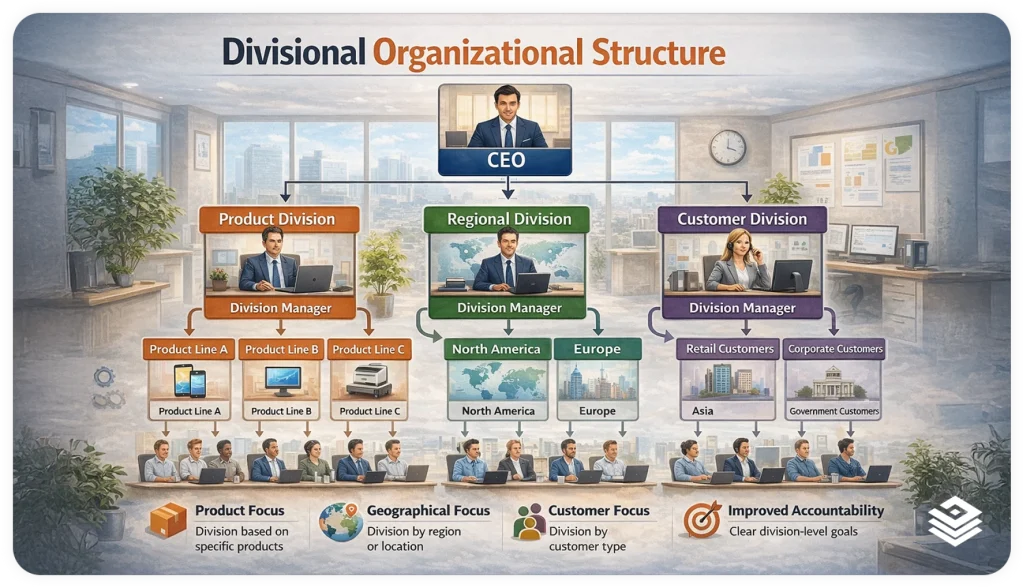
A divisional org chart groups teams by product lines, regions, or business units. Each division operates almost like its own mini organization with its own leadership, teams, and goals.
This kind of structure is particularly beneficial to expanding businesses that have a hand in various markets, products or regions. The accountability remains clear while every department is still able to concentrate on its particular goals.
5. Network or Hybrid Org Chart
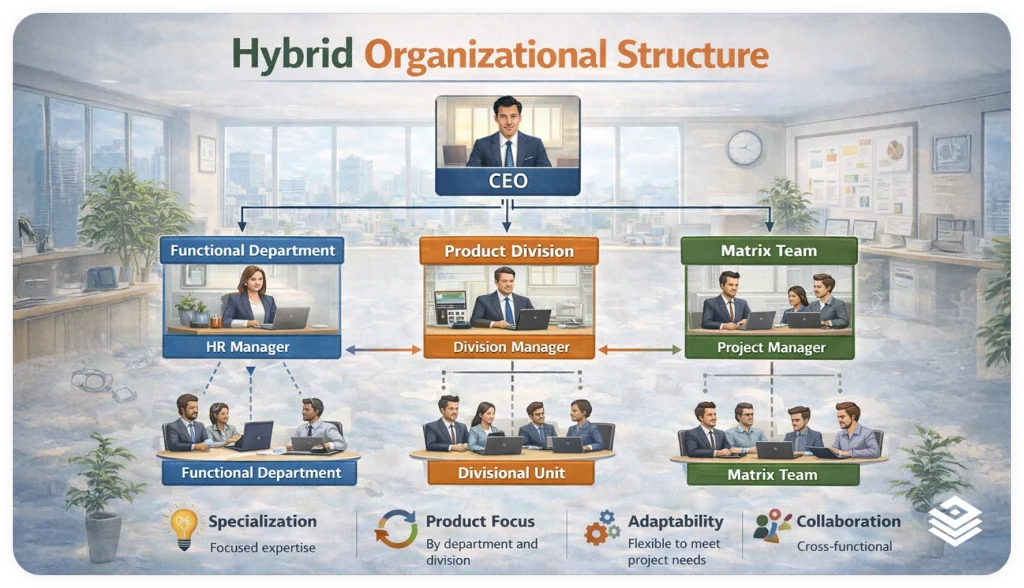
Modern organizations mix different organizational structures. Remote teams, contractors, partners, and internal teams may all be linked through flexible reporting paths. Such structures put emphasis on collaboration rather than a rigid hierarchy.
AI-powered tools make these complex structures much easier to visualize and maintain.
Why AI is Changing the Way Teams Build Org Charts
Picture this. You open your laptop on a Monday morning, ready to update your organizational chart after a weekend full of new role changes and team reshuffles. As you are dragging one box, another shifts out of place. You are changing the size of the title, and the whole layout is falling apart. Just when you are done with this, a colleague sends you a message saying that the structure has been changed again.
Manual updates, formatting chaos, and endless reshuffling can drain hours of your day. That is where AI walks in and transforms the entire experience.
AI looks at your role details and figures out your company structure, then quickly makes a nice, full org chart for you. It takes what you give it and automatically shows how everything is set up. Instead of fighting with boxes and lines, you get a neat chart that’s all set to check out and pass around.⚡?
Better yet, when your team expands or changes, AI instantly adjusts. Recently hired? A revised title? Department split? The chart updates without your effort to reconstruct anything. This provides your firm with instant visibility and assists in keeping your diverse teams in sync regardless of their different locations and even time zones.
Now that we’ve looked at how AI can change your workflow, let’s talk about the real advantages of using an org chart tool.

Benefits of Using an Organizational Chart Tool
Imagine opening a tool that instantly gives structure to your entire organization. No messy spreadsheets, no scattered diagrams, no uncertainty about who reports to whom. Organizational chart software is like a magic wand, turning the complicated into the clear, and it even helps your whole team to be better connected and informed. Using these tools, you get the following benefits.
1. Clear Visibility Across Teams
When your chart gets opened up like a map, everyone immediately recognizes his/her position in the bigger story. Reporting lines, roles, and the links between departments can all be seen at one glance. Such clarity has a great impact on global and remote teams, as if they were together even though there are huge distances separating them.
2. Faster Updates Without Manual Rebuilding
Formatting chaos is no longer a consequence of team changes. Whenever a new employee is added or a title is modified, the layout instantly gets updated behind the scenes. What took several hours before has now become a very short, almost effortless moment.
3. Professional and Polished Design
Your org chart becomes more than a diagram. It is now a visual that you will not hesitate to present to new employees, in leadership meetings, or even in investor presentations. Clear lines and evenly distributed spaces create a movie-like presence for your organization without you having to use any design tools whatsoever.
Know the Strategies:
4. Reduced Workflow Confusion
When responsibilities are unclear, teams slow down. An org chart tool fixes this by becoming your single source of truth, where every role and reporting path is easy to trace. With fewer “Who handles this?” moments, your team moves with more confidence and speed.
5. Easier Strategic Planning and Decision Making
A detailed chart reveals the strong and weak areas in the organization. You can immediately detect the lack of structure, the teams that have too much work, and the positions that are not filled. It transforms your organizational chart from a static document that is forgotten into a strategic lens that directs decisions.

DID YOU KNOW?
Organizations with clearly documented structures experience up to 25 percent fewer workflow bottlenecks, according to Harvard Business Review.
Now that you understand the benefits, let’s walk through how to build your own organizational chart step by step.?
How to Make an Org Chart Step by Step
Creating an org chart does not have to feel like you are piecing together a puzzle in the dark. When you follow a simple flow, your structure begins to reveal itself with clarity and confidence. Here is how you can build one that feels organized, intuitive, and ready for your entire team.
Step 1: Gather the Key Information
Start by collecting job titles, reporting relationships, and department groupings. Consider this as making the cast list before the shooting starts. The better the specifics, the easier the chart will be formed.
Step 2: Choose a Tool That Fits Your Workflow
Pick an organizational chart maker that is user-friendly and addresses the requirements of your group. Look for tools that support quick modifications, offer good graphics, and are AI-powered. Depending on the right platform, you might save a lot of time while keeping the chart precise as your staff grows.
Step 3: Add Roles and Connect the Reporting Lines
Begin placing roles into the tool and linking managers to their teams. Soon, you will see your system pretty much like a storyboard that finally makes sense. This is the moment when hierarchy becomes a visual narrative.
Step 4: Customize the Look and Layout
Modify the colors, space, and grouping to fit your organization’s vibe. Just a couple of changes can uplift your chart from merely functional to quite attractive. Make it something people like to look at and use as a reference.
Step 5: Review and Share With Your Team
Make sure everything is correct by checking names, titles, and links again. When it’s done, send it out to all the departments so that everyone can agree on the structure. A chart that everyone can see helps everyone understand.

Pro Tip:
Organizing processes and updates in a Living Document helps teams stay aligned and work more efficiently.
Now that you know how to create an org chart, here’s a tool to make the whole thing even easier. ?
Recommended Pick: Bit.ai’s Organizational Chart Tool
Bit.ai is an AI-powered docs, wikis, and a knowledge management platform built for teams that want structure, clarity, and creativity to flow effortlessly. Bit.ai turns the once tedious task of building organizational charts into a dynamic visual experience. Instead of dragging boxes or wrestling with design, you watch your hierarchy take shape in seconds with help from Bit’s powerful AI.
Bit.ai does more than display organizational charts. It helps teams keep their structure documented and easy to update inside collaborative documents. Whether you are onboarding talent across continents, presenting to leadership, or aligning departments, Bit.ai gives your org chart the cinematic clarity it deserves.
And with AI Genius Writer built right in, you can generate role descriptions, team summaries, reporting explanations, and documentation that fits your chart perfectly. No more staring at a blank page. Bit helps you shape your organizational story from visuals to words.
Why Divisional Organizational Structures Work Well With Bit.ai
Divisional organizational structures separate teams based on products, regions, or business units. This model requires clear documentation, independent ownership, and easy access to information across divisions.
Bit.ai supports this structure by allowing each department to have its own dedicated workspace for procedures, documents, and role descriptions, and at the same time, the management can access information of all the teams if required.
This approach helps organizations avoid confusion between departments while keeping knowledge organized, searchable, and consistently updated.
Key Features:
1. Rich Docs, Wikis, and Knowledge Management
Bit.ai helps you make engaging documents, wikis, and knowledge bases all in one centralized workspace.
You are able to insert images, tables, embeds, and media to make your documents look trendy and vibrant.
2. AI Genius Writer for Content Creation
AI Genius Writer is a powerful feature that helps you in writing outlines, summaries, descriptions, and structured content. This helps teams create documentation faster and maintain consistent quality.
3. AI Doc Builder
With Bit.ai’s AI-powered Doc Builder, creating a well-structured document takes just a few minutes. By answering 2–3 questions, you can instantly get a ready-to-use document with a clear layout and logical sections where no manual formatting is needed.
And the most amazing part is that the Doc Builder supports rich, interactive content from third-party tools. So, you can seamlessly embed organizational charts from tools like Lucidchart, Miro, or Draw.io right into your document, alongside goals, role descriptions, and supporting notes. That way, your whole organizational setup will be neat, contextual, and teams will find it very easy to understand all in one single connected workspace.
4. Real-Time Collaboration and Sharing
Multiple users can work together in real time. You can comment, co-edit, and keep everything aligned inside a shared workspace. Your team always works on the latest version of the chart or document.
5. Flexible Document and Media Support
You can embed files, links, videos, images, and other types of media to make the documents rich and informative. Bit.ai supports a large variety of content, which turns your workspace into a well-connected knowledge hub.
6. Scalable Workspaces and Templates
Organize information through workspaces, folders, wikis, and documents. Bit.ai includes 100+ beautiful templates for onboarding, SOPs, training materials, org charts, and many other workflows.
7. Easy Sharing, Embedding, and Permissions Control
Share documents with a link, set access controls, and even control whether guests are allowed to view or edit the document. On top of that, you have an option to embed your Bit.ai docs in any other websites or tools when needed.
Pricing
Bit.ai offers a free plan for individuals. The Pro plan starts at $8/month and the business plan at $15/month.
Pro Tip:
Use Bit’s Organizational Chart Tool to create interactive, easy-to-update org charts that visualize teams clearly and share structure faster than traditional static charts.
Now that you have seen how Bit.ai elevates the entire experience, let’s explore how you can actually build and manage org charts inside the platform. ??
How to Create Org Charts in Bit.ai
Making an org chart in Bit.ai is like telling a story rather than making a diagram. The platform has a combination of AI-based structure and easy-to-use controls that allow your hierarchy to develop smoothly and naturally. Here is how you can build, refine, and share an org chart that your entire team will instantly understand.
Step 1: Open a New Document or Workspace
Start by creating a fresh document or jumping into an existing workspace where your team keeps its knowledge. This becomes the home for your chart, supporting all the context, notes, and documents that surround it.
Step 2: Use the AI Prompt for Organizational Charts
Enter your team details or use the ready-made AI prompts to generate your structure. Bit’s AI instantly reads your inputs and produces a clean hierarchy that feels balanced and presentation-ready.
Step 3: Customize Your Roles and Reporting Structure
Refine job titles, update reporting paths, or shift departments as needed. Bit.ai’s flexible editing lets you keep your structure clean, clear, and easy to update whenever your structure changes.
Step 4: Enhance the Chart With AI Genius Writer
Put role descriptions, department info, or workflow summaries right under your chart. AI Genius Writer can help you write this content quickly, so you get a full view of how your company works.
Step 5: Share and Collaborate With Your Team
Publish your chart, share it via link, or link it into other Bit documents. Your team members can write comments, provide feedback, and work together, thus keeping everybody updated with the most recent organization structure.
Bonus Tip
Use AI Genius Writer to create onboarding paragraphs for each department right beside your org chart. It gives new hires instant clarity and reduces orientation time.
Now that you know how to create and manage your chart inside Bit.ai, let’s bring everything together in a smooth, cinematic wrap-up.
Wrapping Up: Smarter Org Charts With AI
Once you finish your org chart, it’s more than just a diagram. It gives you a real-time view of how your team works, grows, and works together, no matter where they are. AI tools make that process smoother by removing the heavy lifting and giving you a structure that adapts as fast as your organization evolves.
With Bit.ai, you get visuals, clarity, and storytelling in one place. Your chart becomes simpler to create, understand, and share with those who need it. AI helps maintain a clear structure for your company, if you are growing the team, handling quick changes, or improving the onboarding.
Now that you understand org charts, let’s answer some common questions to give you confidence as you move forward. ?
FAQs
- How can you generate an organizational chart with AI?
AI tools examine the roles, titles, and management structure you input and then build a structured org chart for you. Instead of manually arranging shapes, the software puts everything into a clear visual format. This saves time and keeps your chart correct as your team gets bigger.
- How accurate are AI-generated org charts compared to manual ones?
AI-generated charts tend to be more consistent because they remove human formatting errors and rely on structured inputs. As long as the information you provide is correct, the layout will remain precise and well-organized. The real advantage is how quickly you can update the chart without rebuilding it.
- How can you create and manage org charts in Bit.ai?
You start by using Bit’s AI prompts to generate your hierarchy based on the details you provide. From there, you can refine roles, adjust reporting paths, and enhance the chart using AI Genius Writer. Bit.ai also makes sharing easy, so your team always works from the latest version.
- How does Bit.ai make organizational planning easier?
Bit.ai centralizes your org chart, documentation, department notes, and workflow context in one workspace. With AI generating structure and content for you, planning becomes faster and more visual. This creates alignment across teams and removes the confusion that often slows down decision-making.
- Why should businesses use Bit.ai for organizational documentation?
Bit.ai provides teams with a unified platform where all charts, wikis, SOPs, and knowledge are integrated. The AI tools enable you to create visuals and texts in no time and with high quality. This eliminates misunderstandings, enhances correspondence, and fortifies the teams spreading fast globally.